The Agent Performance Dashboard
The Performance Dashboard enables you to monitor your own performance, the performance of any queues you work on, as well to get real-time information about the number of colleagues who are available for work.
In this section, discover how to control the Performance Dashboard and understand the meaning of the various metrics it provides.
This article assumes you are familiar with the layout of the Agent application.
Accessing the dashboard
The dashboard is found at the right hand side of the central work area.
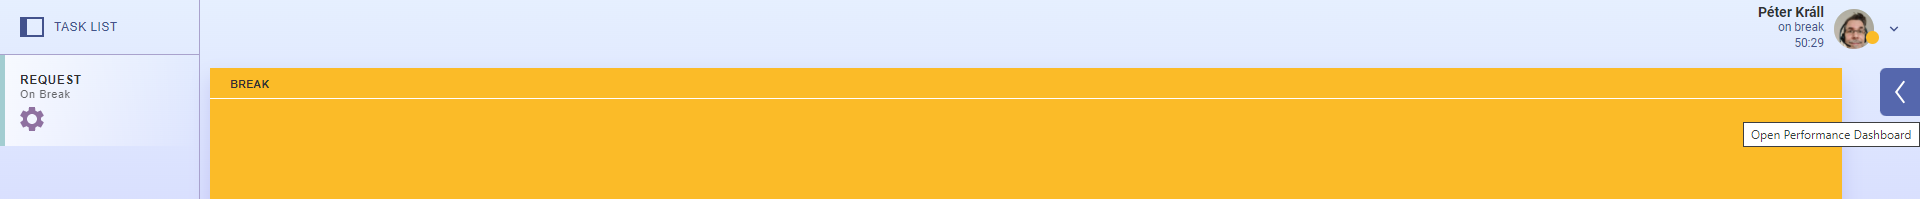
When hidden, click the arrow icon to reveal it. Use the same icon to hide it.
The Agent application remembers your dashboard visibility selection for your next login session.
Dashboard sections
The agent performance dashboard consists of multiple pages of information. You access these sections by clicking the tab icons at the top of the dashboard.

Favorites
You can pin certain measures to the Favorites section. You do this by clicking the star icon at the left of the measures in any of the section. The star icon turns yellow, and the measure is added to the Favorites.
To remove a measure from the Favorites, click its yellow star icon either in the Favorites section or in the home section of the respective measure.
When items are presented, use the arrow icons to toggle their visibility.
Agent performance
This shows your performance in each media type like Voice, Email, Webchat, etc. Use the arrow icons to toggle the visibility of each measure.
Each media type is presented on a separate tile in the dashboard.
Stats visible:
Handled - The number of tasks handled today.
Average handling time - The average handling time for each type.
Where no tasks have been completed, the text “No tasks handled yet” appears.
Queues stats
There are 5 stats displayed for each queue. Use the arrow icons to toggle the visibility of each measure.
SLA – The Service Level Agreement is expressed as a percentage.
It shows the number of tasks that were handled within the target time in the service level agreement, divided by the total number of items.
If no tasks have been handled, or if your supervisor configured no SLA for the queue, the text n/a is displayed.
LWT – This stands for Longest Waiting Time and is expressed as a time duration.
It shows the longest waiting time among all the conversations currently in the queue.
If no tasks are waiting, the text n/a is displayed.
Waiting – The number of conversations in the queue. Expressed another way, the number of tasks waiting, and yet to be handled by an Agent.
Accepted – The number of tasks accepted by agents.
Abandoned – The number of tasks that were dropped by customers while they were in the queue.
Note
On top of customers hanging up while waiting in a queue, the Abandoned stat can be influenced by other factors too. If a queue is configured with a timeout period and a conversation's wait time exceeds that, than this will count as 'Abandoned' for this queue. Similarly if the maximum number of conversations allowed in the queue is reached, or if no agent is logged in to take calls, the Abandoned value is increased for this queue.
Team stats
This presents the availability of your co-workers in the teams you participate in. Use the arrow icons to toggle the visibility of each measure.
Total logged in – The number of agents within a team, including you, that are logged in.
Available – The number of agents in idle state, ready to handle conversations.
On break – The number of agents in break state.
Busy – The number of agents busy with a conversation.
Availability Stats
This presents the aggregated time duration you spent in various agent states. Use the arrow icons to toggle the visibility of each measure.
My Availability
- Logged in time - Duration of time you were logged in today.
- Available - The total time you were waiting for tasks while being available for them.
- On break - Duration of all the time in any of the break types.
- Busy - The total time you have been busy handling tasks.
My Breaks - stats visible
- Your contact center break states - Duration spent in any of the break states created for your contact center. Repeats for each break state used.
- Default Break - Duration of time in the default break state
Queue items
This displays conversations currently waiting in the queues assigned to you.
Show All Items
Clicking this will list all the conversations waiting in automatic queues you have access to. You can not pick items from automatic queues, but can see their properties such as the customer name, identifier, media type as well as queue name and queue time.
Manual Assignment
This lists tasks you can pick from the manual queues. Click an item and click the Add to task list button to remove a task from a manual queue and place it into your task list.
This list will only be populated if your administrator assigned you to manual queues.
About data refresh intervals
These reports communicate with our backend services every 10 seconds. This might result in data variations when comparing multiple different agent application websites in different browser tabs or browser applications. This is perfectly normal as the refresh polling likely started at different times for each.
Therefore, we do not guarantee that all agent performance dashboards, whether in the same browser or different, present the exact same set of data.