Agents Report
Agent Performance
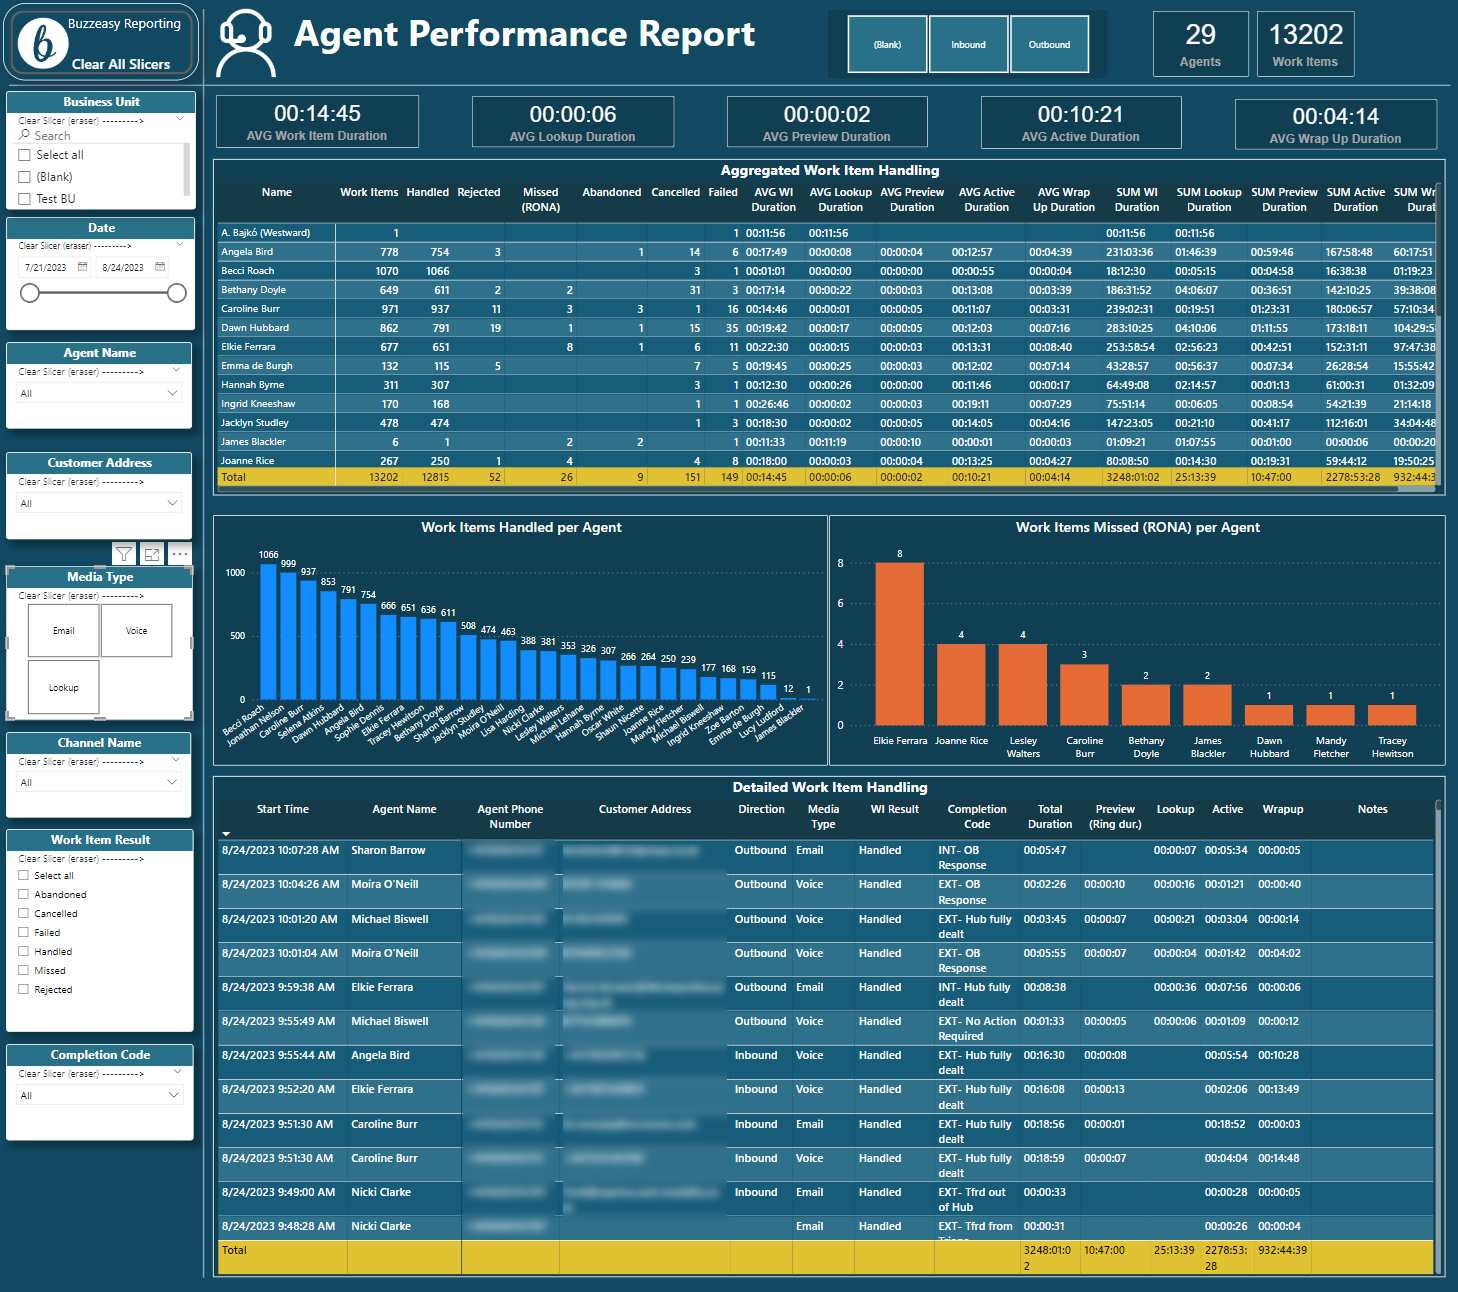
This page displays information about the human agents as they relate to the work items (Buzzeasy tasks) they were associated with.
Note
Agents who did not receive or initiate any work items within the filter parameters will not appear on this page.
AVG Work Item Duration
The average amount of time an agent spent with a work item from its beginning to its end, i.e. from the moment the work item was delivered to/created by the agent to the moment the work item was closed.
AVG Lookup Duration
The average amount of time an agent spent on a lookup work item searching for or editing customer information, scheduling calls or running scripts on demand.
AVG Preview Duration
The average amount of time an agent spent previewing a work item before accepting it. In the case of voice calls this is equivalent to the time the call was ringing at the agent.
AVG Active Duration
The average amount of time an agent spent in active conversation.
AVG Wrap Up Duration
The average amount of time an agent spent with a work item wrapping it up, i.e. from the end of the effective conversation with the customer to the closure of the work item.
Aggregated Work Item Handling
Table counting how many work items each agent was associated with. The table also displays some other relevant details.
| Column Name | Description |
|---|---|
| Name | The agent's name. |
| Work Items | Number of work items associated with the agent. |
| Handled | Number of work items handled by the agent. |
| Rejected | Number of work items rejected by the agent. |
| Missed (RONA) | Number of work items missed (failed to accept in the allotted amount of time) by the agent. |
| Abandoned | Number of work items associated with the agent that were abandoned by the customer. |
| Cancelled | Number of work items that the agent initiated but then canceled without establishing a conversation. |
| Failed | Number of work items that failed due to a technical error. |
| AVG WI Duration | The average amount of time the agent spent with a work item from its beginning to its end. |
| AVG Preview Duration | The average amount of time the agent spent previewing a work item before accepting it. |
| AVG Lookup Duration | The average amount of time the agent spent with a work item searching for an outbound contact. |
| AVG Active Duration | The average amount of time the agent spent in active conversation. |
| AVG Wrap Up Duration | The average amount of time the agent spent with a work item wrapping it up. |
| SUM WI Duration | The total amount of time the agent spent with a work item from its beginning to its end. |
| SUM Preview Duration | The total amount of time the agent spent previewing a work item before accepting it. |
| SUM Lookup Duration | The total amount of time the agent spent with a work item searching for an outbound contact. |
| SUM Active Duration | The total amount of time the agent spent in active conversation. |
| SUM Wrap Up Duration | The total amount of time the agent spent with a work item wrapping it up. |
Work Items Handled per Agent
Column chart displaying the amount of work items each agent handled, i.e. was presented with and accepted.
Work Items Missed (RONA) per Agent
Column chart displaying the amount of work items each agent missed, i.e. did not accept. This is the number of calls the agent failed to answer within the allotted amount of time and thus was put in the RONA (Redirect On No Answer) break state.
Detailed Work Item Handling
Table showing the details of each individual work item.
| Column Name | Description |
|---|---|
| Start Time | The date and time (in the tenant's set timezone) of when the work item was created (presented to the agent). |
| Agent Name | The agent's name. |
| Agent Phone Number | The agent's phone number at the time of the conversation. |
| Customer Address | The email address or phone number of the customer depending on the media type. |
| Direction | The direction of the conversation from the perspective of the contact center (only where applicable). |
| Queue Name | Name of the queue where the conversations were waiting. |
| Media Type | The type of media of the work item. |
| Work Item Result | The outcome of the work item. What happened to it ultimately. The values are set by the system. |
| Completion Code | The completion code chosen by the agent for the work item. The values are set by the contact center administrator. |
| Total Duration | The amount of time the work item existed from its creation to its closure. |
| Preview (Ring dur.) | The amount of time the agent spent previewing the work item before accepting it. |
| Lookup | The amount of time the agent spent with the work item in lookup mode (relevant to outbound conversations only). |
| Active | The amount of time the agent spent in active conversation with the customer. |
| Wrapup | The amount of time the agent spent with the work item wrapping it up. |
| Notes | The note attached to the work item by the agent. 'Automatically closed' is attached by the system. |
| Work Item Id | The technical identifier of the work item. |
Agent States
This page displays information about the human agents' time spent in the various contact center states and also provides a detailed list of every state change they performed.
Note
Agents who did not make any state changes within the filter parameters will not appear on this page.
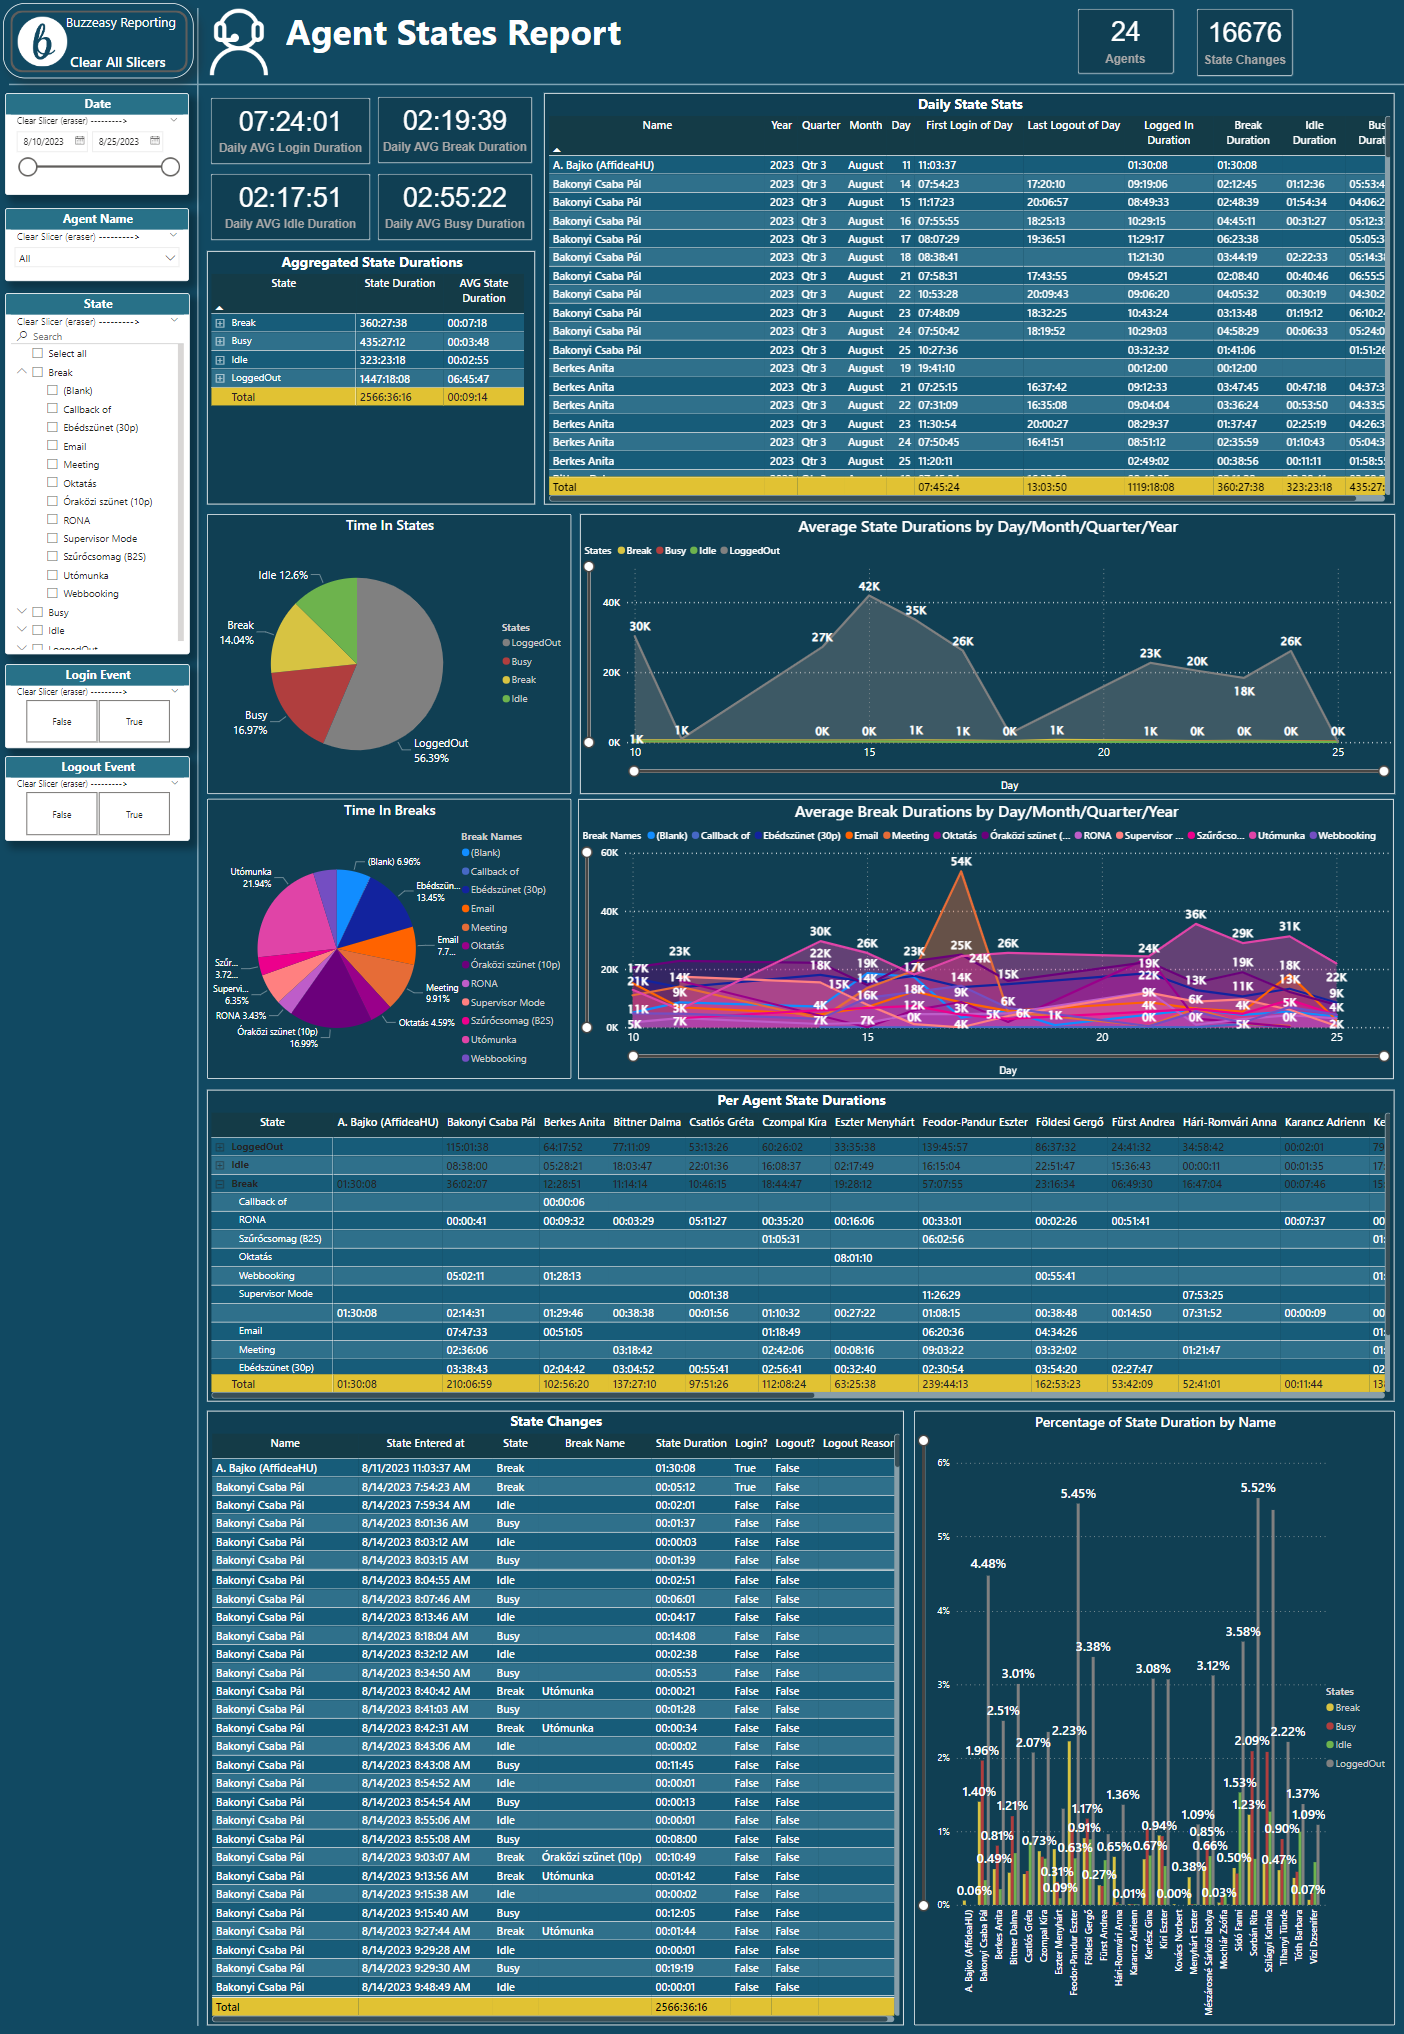
Daily AVG Login Duration
The average amount of time per day an agent was logged in.
Daily AVG Break Duration
The average amount of time per day an agent was in a break state.
Daily AVG Idle Duration
The average amount of time per day an agent was in the available state.
Daily AVG Busy Duration
The average amount of time per day an agent was in the busy state.
Daily State Stats
Table showing at what time of the day each agent logged in for the first time and logged out for the last time.
Furthermore, the table also provides columns of aggregated time showing how much time during that day the agent spent in the various states.
Aggregated State Durations
Table showing how much time was spent in each type of state (Break, Busy, Idle, LoggedOut) and in each of the custom break states by all filtered agents.
| Column Name | Description |
|---|---|
| State | The type of state. |
| Break Name | The custom break names configure for your tenant. |
| State Duration | The total amount of time that filtered agents spent in the state. |
| AVG State Duration | The average amount of time an agent spent the state. |
Time In States
Pie char of what percentage of time was spent in each type of state (Break, Busy, Idle, LoggedOut)
Average State Durations by Day/Month/Quarter/Year
Area chart showing the average amount of time (in seconds) spent in each state per day, month, quarter or year.
Tip
Use the up arrow  to drill up a layer and the double down arrow
  to drill down a layer.
Time In Breaks
Pie char of what percentage of time was spent in each of the custom break states. These are the break reasons or break names configure for your particular tenant.
Note
You may see a '(Blank)' break name which is the default break code. This is used when the agent first logs in and/or there are no custom break names configured for your tenant.
Average Break Durations by Day/Month/Quarter/Year
Area chart showing the average amount of time (in seconds) spent in each break state per day, month, quarter or year.
Per Agent State Durations
Table showing how much time each individual agent spent in each type of state (Break, Busy, Idle, LoggedOut) and in each of the custom break states.

State Changes
Table showing every state change within the filter parameters.
Percentage of State Duration by Name
Column chart showing what percentage of the total time did each agent spend in each state type. It's not each agent's values that add up to 100% but all displayed values.
Tip
There is a zoom slider on the left edge of the visual to help see small values.
Pending States
Table showing the agents' pending states that they requested while still busy with at least one work item. If the agent requested multiple different states this way, only the last of them will be shown in this table. The agents would have actually entered these states once their work items were closed.