The Queues Report
Select Queues under the Realtime Reports section in the portal sidebar to display the Queues Report.
This report is filtered by your associated business unit(s). If your account is a user without agent or supervisor type, the report will show entries from all business units.
Queues core KPIs
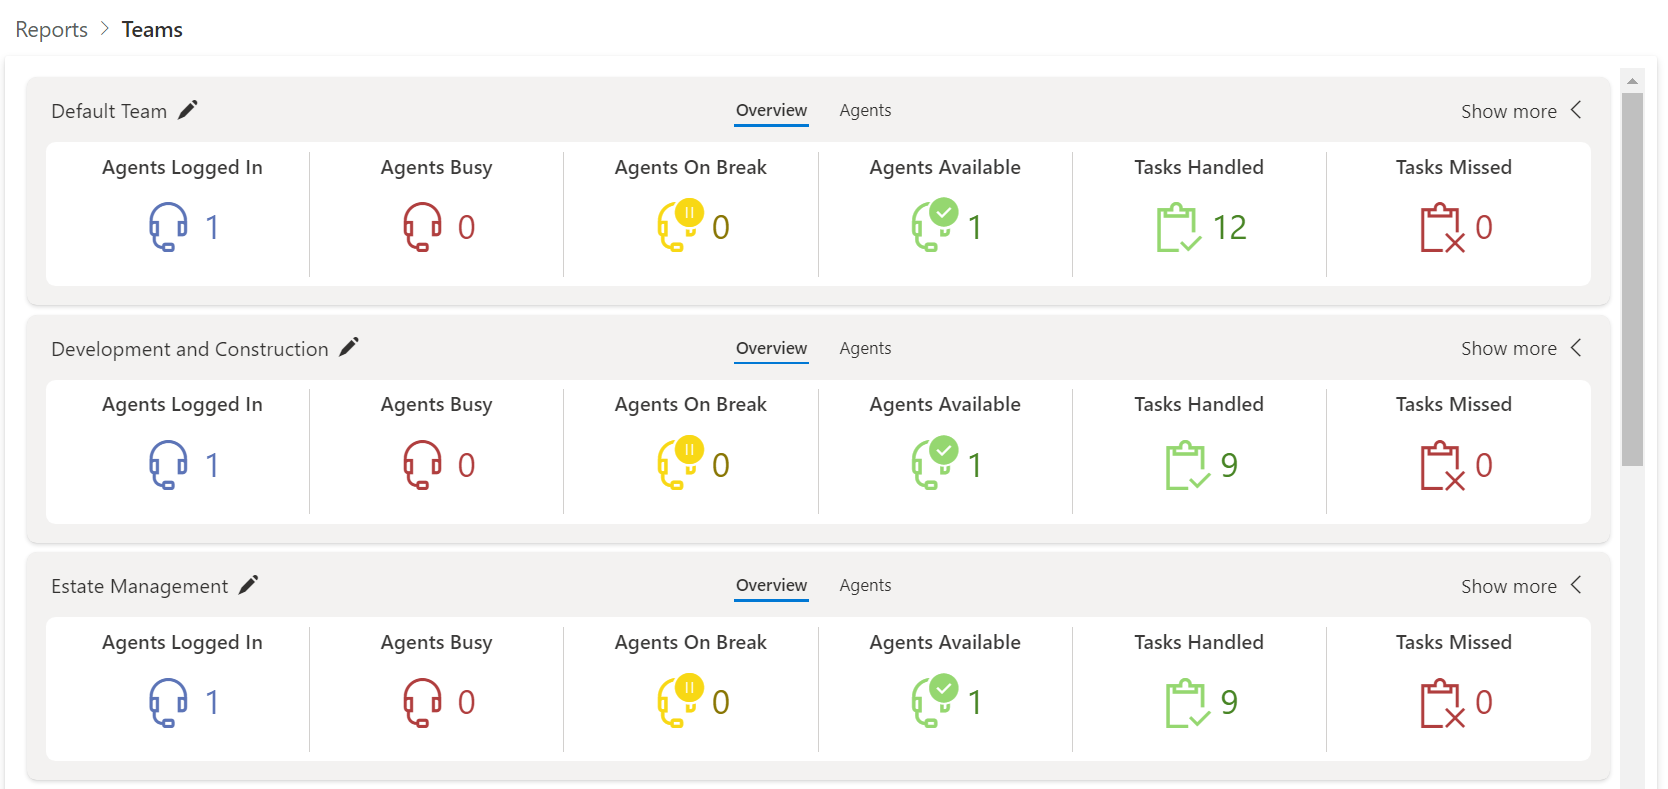
Initially each queue’s dashboard displays six core summary KPIs.
| KPI | Description |
|---|---|
Service Level |
Service level for today. |
Current LWT |
The current longest wait time of the day. |
Waiting |
Total conversations waiting in the queue. |
Connected |
Total conversations connected with agents. |
Completed |
Daily total of completed conversations. |
Abandoned |
Daily total of abandoned calls. |
Tip
When viewing a lot of queues, try adjusting the zoom settings of your browser.
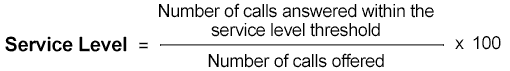
Service level definition
Buzzeasy uses the following formula to calculate the Service Level.
Drill into KPIs
KPIs presenting a magnifying glass icon can reveal further relevant details, typically in the form of tabular data.
Click the magnify icon to see the additional details. Many details of the conversation are listed, including the media type, conversation direction, and the identity of the caller or correspondent.
Drill into the Waiting KPI
Drilling into the Waiting KPI presents a tabular list of conversations waiting for an agent.
| Field name | Description |
|---|---|
Position |
The queue position of the conversation. |
Wait time |
The duration spent waiting in queues. |
Customer name |
Name in the customer record, if available. |
Customer identifier |
External identifier in the customer record, if available (e.g. for chat conversations). |
Type |
Type fo the conversation, e.g. callback, or direction like inbound, etc. |
Preferred agent |
The name of the agent as set to be preferred in the customer record. |
Drill into the Connected KPI
Drilling into the Connected KPI presents a tabular list of conversation that connected with at least one agent.
| Field name | Description |
|---|---|
Connected time |
The duration the customer spent connected with any agents. |
Customer name |
Name in the customer record, if available. |
Customer identifier |
External identifier in the customer record, if available (e.g. for chat conversations). |
Agents |
The name of all the agents this conversation was connected to. |
Type |
Type fo the conversation, e.g. callback, or direction like inbound, etc. |
Drill into the Completed KPI
Drilling into the Completed KPI presents a tabular list of conversation that were completed.
| Field name | Description |
|---|---|
Timestamp |
The time the conversation got completed. |
Total time |
The total lifetime of the conversation. |
Connected time |
The duration the customer spent connected with any agents. |
Wait time |
The duration spent waiting in queues. |
Self-service time |
The duration spent with self-servicing bots, e.g. menu selection. |
Customer name |
Name in the customer record, if available. |
Customer identifier |
External identifier in the customer record, if available (e.g. for chat conversations). |
Type |
Type fo the conversation, e.g. callback, or direction like inbound, etc. |
Drill into the Abandoned KPI
Drilling into the Abandoned KPI presents a tabular list of conversations that are considered abandoned while waiting in queue.
| Field name | Description |
|---|---|
Timestamp |
The time the customer decided to abandon waiting in the queue. |
Wait time |
The duration spent waiting in queues. |
Customer name |
Name in the customer record, if available. |
Customer identifier |
External identifier in the customer record, if available (e.g. for chat conversations). |
Additional KPIs
Click Show more at the top right corner of the team dashboard to view additional KPIs. The control label changes to Show less.
Toggle the expanded or collapsed view by clicking these controls.
Wait time today
This presents two speedometer visuals.
| KPI | Description |
|---|---|
(Wait Time Today) Longest |
The longest wait time of the day. |
(Wait Time Today) Average |
The average wait time of the day. |
Callback requested
A summary.
| KPI | Description |
|---|---|
Callback requested |
Total number of callbacks requests for today. |
Timed Out
A summary.
| KPI | Description |
|---|---|
Timed Out |
Total number of callback requests today that have timed out. |
Edit visual thresholds
Apply threshold values to KPIs for quick feedback on performance trends. When thresholds are met, KPI visuals change to draw your attention.
Select Queues from the Realtime Reports section in the Buzzeasy Portal sidebar.
Identify the queue where you want to edit a threshold, and click Show more at the top right hand corner of the dashboard to view the current KPI trends.
Click the Edit thresholds icon at the top left corner of the dashboard, right next to the team name label.
Set the one or more of the following thresholds:
Desired SLA percentage
Desired longest wait time
Desired average wait time
Desired max waiting conversation count
Abandoned threshold time
Save the updated thresholds.
Watch the KPIs and notice how the style changes as the threshold values are met.