Buzzeasy Historical Reporting
Buzzeasy provides two types of reporting:
Live reporting at Buzzeasy Portal | Documentation of live reports
Historical reporting - Microsoft Power BI
These pages focus on historical reporting covering the ability to look at aggregated data from the system, going back to the tenant's configured data retention period.
While this document mentions high level operational steps in certain Microsoft products and services, it is by no means a substitution of the official documentation of these. Please consult with the official documentations for detailed instructions and guidance.
Historical reporting
As part of our historical reporting offering, Buzzeasy provides the means to get high-level to low-level feedback on the performance and operation of various entities and features such as bots, queues, agents, work items, conversations in all the media types (calls, emails, various messaging).
The data is usually available in historical reporting within a few minutes of the event occurring in the system. Nevertheless, in order to avoid overexertion of historical reporting resources and for the purposes of monitoring data from the current day, we suggest using the Buzzeasy Portal's live reports and Power BI historical reports to analyze data from at least the previous day.
Buzzeasy OData feed
Buzzeasy offers its historical data via an OData feed – a secured stream of structured data via an application interface. We do not provide a ready-to-consume graphical user interface because there are freely available professional solutions for this purpose, like Microsoft Power BI.
What is Power BI
Historical reports for Buzzeasy are created using Microsoft Power BI. Power BI is an interactive data visualization software product developed by Microsoft with a primary focus on business intelligence. The reports can be viewed either through the web at Power BI Service or in the desktop application Power BI Desktop (free tool) by opening a file from Buzzeasy.
Power BI can gather raw data from various sources including the OData feed from Buzzeasy. The data acquired from these data sources are then viewed, edited, and published in the Power BI Desktop application.
Publishing the report to the Power BI Online Service has many advantages, such as easily sharing the report with colleagues, embedding the report in Microsoft Teams, setting up subscriptions, creation of dashboards.
Power BI online service requires Power BI Professional or Premium license.
Buzzeasy historical reporting is tested with Microsoft Power BI, and this is the BI suite we support.
Historical report prerequisites
In order to consume Buzzeasy's OData feed through Power BI and see/construct reports from it, you will first have to fulfill these requirements:
Have a valid Microsoft Organizational ("Work") account in your corporate Entra ID (Azure AD).
Have this account registered in Buzzeasy. The account needs a one time activation upon registering, this is done by clicking the link in the activation email from Buzzeasy.
On the Buzzeasy portal, have the Power BI access option enabled for the user associated with the account. Read more on user management.
Create the necessary Buzzeasy entities like channels (and by extension workflows, queue treatments, announcements and campaigns).
To be able to log in via Power BI, Buzzeasy needs an additional permission (basic profile view) from your corporate Entra ID that is not requested at the standard portal or agent user interface login. For the very first Power BI login, a system administrator of your Entra ID must consent to Buzzeasy's access on behalf of your organization.
- To avoid login issues, trigger this admin consent by having an administrator click the below link before any user attempts to log in via Power BI.
https://login.microsoftonline.com/common/adminconsent?client_id=0f0d8e91-10ab-4f2c-ae88-9c89aefc9b4a.
Note
It is critical to trigger this initial Entra ID admin consent outside of Power BI because Power BI can not handle this. Otherwise Power BI login would fail with an error message similar to this:
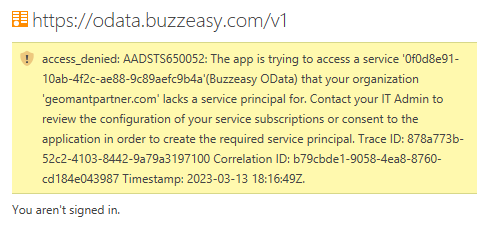
Read more about Buzzeasy's Entra ID admin consent request.
Accessing the Power BI reports
The report file can be opened using Power BI Desktop application.
Report file formats
There are two types of report files:
.pbit: a template file, these contain data structure only (no data), it is used to ship and manage small files.pbix: file extension includes the data last refreshed, these can grow large
The files Buzzeasy publishes are template files. Upon opening them for the first time, you may be asked to (and may wish to) specify some query parameters before data load can start. See the tooltips next to each parameter to help you enter a correct format.
Logging in to the Buzzeasy OData feed
We ship our report template file with our OData feed details filled, but you will of course need to provide login credentials.
To view the OData feed address and update your credentials, open Transform data from the Home menu in the Power BI desktop application, and select the Data source settings item.
Our OData feed address is:
https://odata.buzzeasy.com/v1/
Buzzeasy uses Organizational authentication so you can use your corporate Entra ID (AAD) credentials to access the reports from Power BI Desktop app. The account also needs to have a user entity in Buzzeasy.
Refreshing the report in Power BI
After downloading the report template file from Buzzeasy and configuring the login details and query parameters, you can start getting data into the file. Upon saving, the data loaded from the feed is stored inside. When opening the file at a later time, you will wish to refresh this dataset to see updated statistics.
There are different ways to refresh the reporting dataset depending on where you're viewing the report from:
Refreshing the report in Power BI desktop application by clicking on the refresh button in the menu ribbon.
Refreshing manually once the report is published to the Power BI online service.
Setup scheduled refresh for the reports published to the Power BI online service.
Note
Power BI Online Services Scheduled refreshes are limited to 8 times a day with Power BI professional licenses.
Different views in Power BI Desktop
In Power BI desktop we differentiate three types of views:
Report view: displays the data and all visuals like tabular data, graphs, charts, etc.
Data view: Shows the raw data in a database rows and columns format
Model view: Shows the relationship between data view tables
In addition to the model view, Buzzeasy OData feed offers a metadata definition file as well at: https://odata.buzzeasy.com/v1/$metadata
Programmatic access to the OData feed
In addition to consuming it from Power BI, the Buzzeasy OData feed can also be used from any able application directly. The login process for this however needs you to involve Buzzeasy as part of the onboarding process.
Upon receiving this request, we will
- create a new API client for this specific purpose and associate it to your Buzzeasy tenant
- provide the two parameters you will need to get an access token with which to use the API:
- client_id
- client_secret
Getting an access token
Once you have your client_id and client_secret, you can use these to get an API access token by sending a POST request to the URL provided to you by Buzzeasy.
A sample request:
curl -X POST -H "Content-Type: application/x-www-form-urlencoded" -d
"client_id=<yourClientId>&client_secret=<yourClientSecret>&scope=odata&grant_type=client_credentials"
<URL>
A sample response:
{"access_token":"<yourAccessToken>","expires_in":3600,"token_type":"Bearer","scope":"odata"}
Calling Buzzeasy OData endpoints
Once you have your access token, include it in each API request's header when calling Buzzeasy OData endpoints with the request header:
Authorization: Bearer <your_token>
Historical report pages
Data visualizations and tables are organized across a number of pages. Each page aims to display information relevant to a particular area of interest such as agents, calls, emails etc.
In general, the layout of a page is as follows:
- Slicers reset button
- Page title
- Object counter card
- Slicers
- Display area (data cards, visuals, tables)
Tip
Filtering the contents of a page can be done with the help of the slicers but also – in some cases – by selecting a particular part of a visual, including table rows. Use this combined filtering to zoom in to the parts of the data you are most interested in.
For example, click on the AgentConnected slice of the pie chart of the Queue Report to highlight that slice of the chart and to show only queued items with this result in other visuals on the same page.
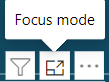
Tip
To view any visual on the full page, hover over the visual, wait for the three option buttons to appear, then click Focus mode
Tip
For a complete list of possible values and their meanings such as QueueTimedOut as a dequeued reason, visit the OData feed technical definition documentation.
Check our glossary of the technical terms used in this and other Buzzeasy related documents.