The Queues Report
The Queues report consists of dashboards of KPI data.
A queues dashboard displays for each of your queues, showing data specific to that queue.
Select Queues under the Reports heading in the portal sidebar to display the Queues Report.
Find out more about the general navigation and operation of all reports in the Navigate and Control Reports and Dashboards section of the guide.
This detailed description section of the guide concentrates on:
The layout of the queues dashboard
Details of the queues dashboard
Description of the queues dashboard KPIs
Setting a data threshold on each KPI where this is a user editable value
Drilling in to show more data on each KPI where this is supported
Key KPIs - Queues Dashboard
Initially each queue’s dashboard displays six KPIs. Refer to these KPIs, as the queue's Key KPIs.
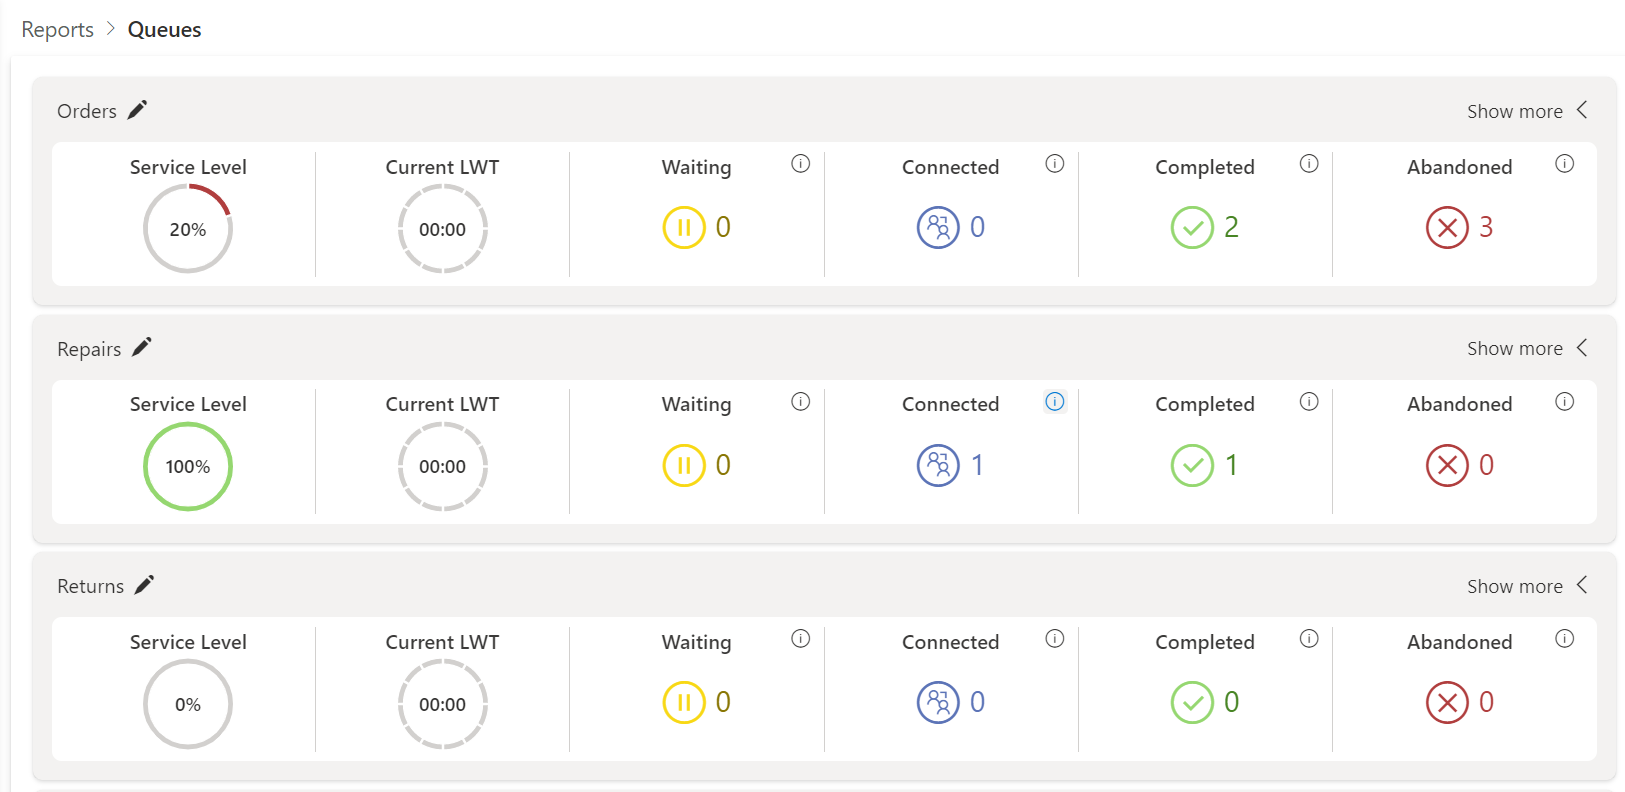
The Queues Report showing three queue's dashboards displaying key KPIs.
Show More KPIs - Queues Dashboard
At the top right of each queue's dashboard is a Show more control.
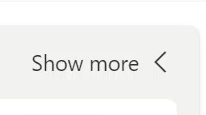
- Select the Show more control to display all the KPIs on each dashboard.
At the top right of the dashboard, The Show more control is replaced by a Show less control.
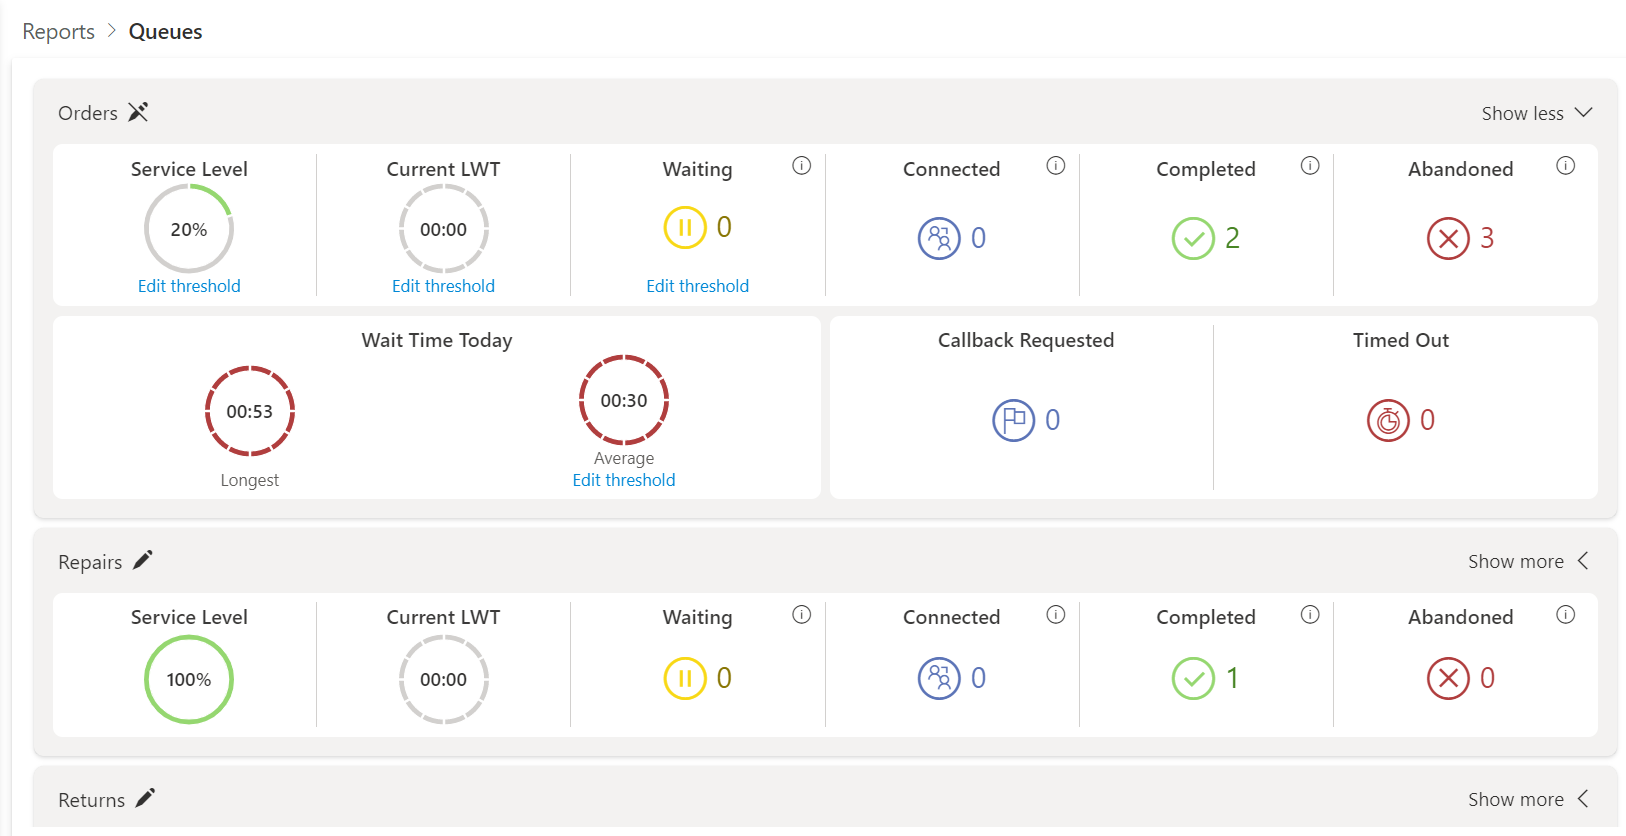
The additional KPIs are:
Wait Time Today - Longest
Wait Time Today - Average
Callback Requested
Timed Out
Show Fewer KPIs - Queues Dashboard
With all the KPIs visible, a Show less control appears at the right of the queue’s dashboard.
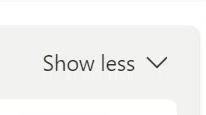
- Select Show less, to hide the additional KPIs and return to the summary view of six key KPIs.
View Details - Queues Dashboard KPIs
An information icon accompanies some of the KPIs in the dashboard.

The information icon
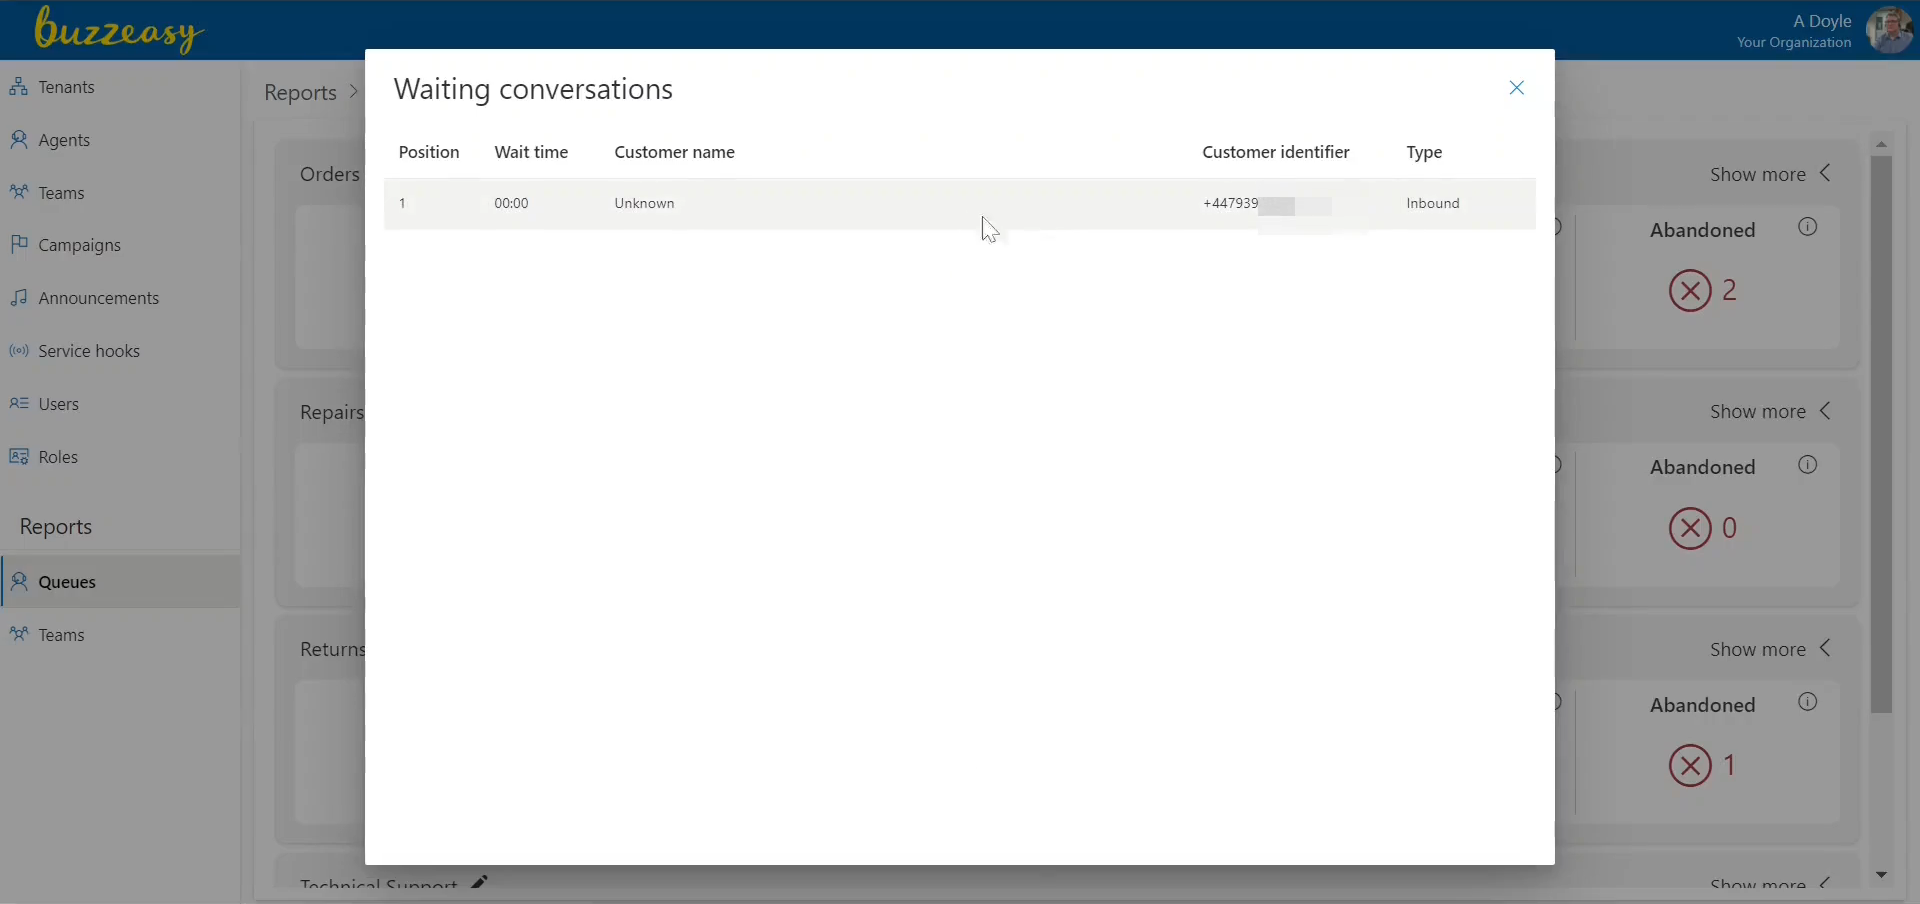
Where a KPI has an information icon, you may select it to view further details.
In the queues dashboard these further details are lists of conversations. Many details of the conversation are listed, including the media type, conversation direction, and the identity of the caller or correspondent.
KPIs THat Display More Information
- Waiting
- Connected
- Completed
- Abandoned
Waiting KPI - Info
- Select the information icon next to the Waiting KPI, to view a list of conversations that are waiting for connection to an agent.
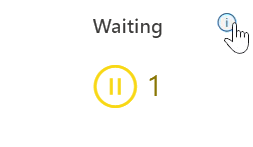
The list of waiting conversations displays.
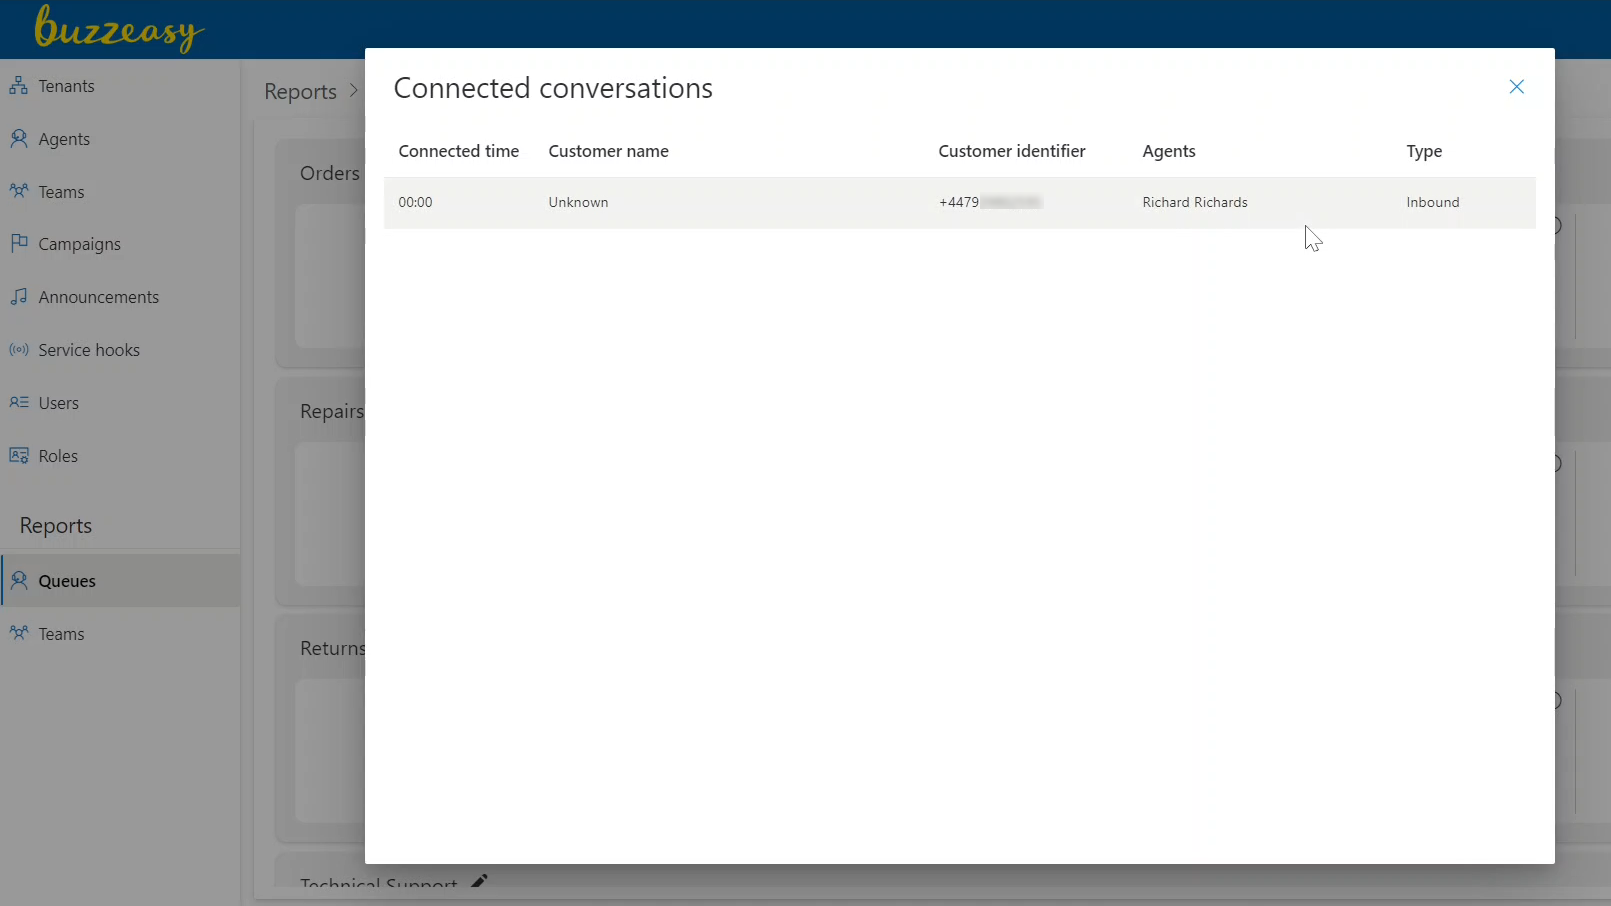
Connected KPI - Info
- Select the information icon next to the Waiting KPI, to view a list of conversations that are waiting for connection to an agent.

The list of connected conversations displays.
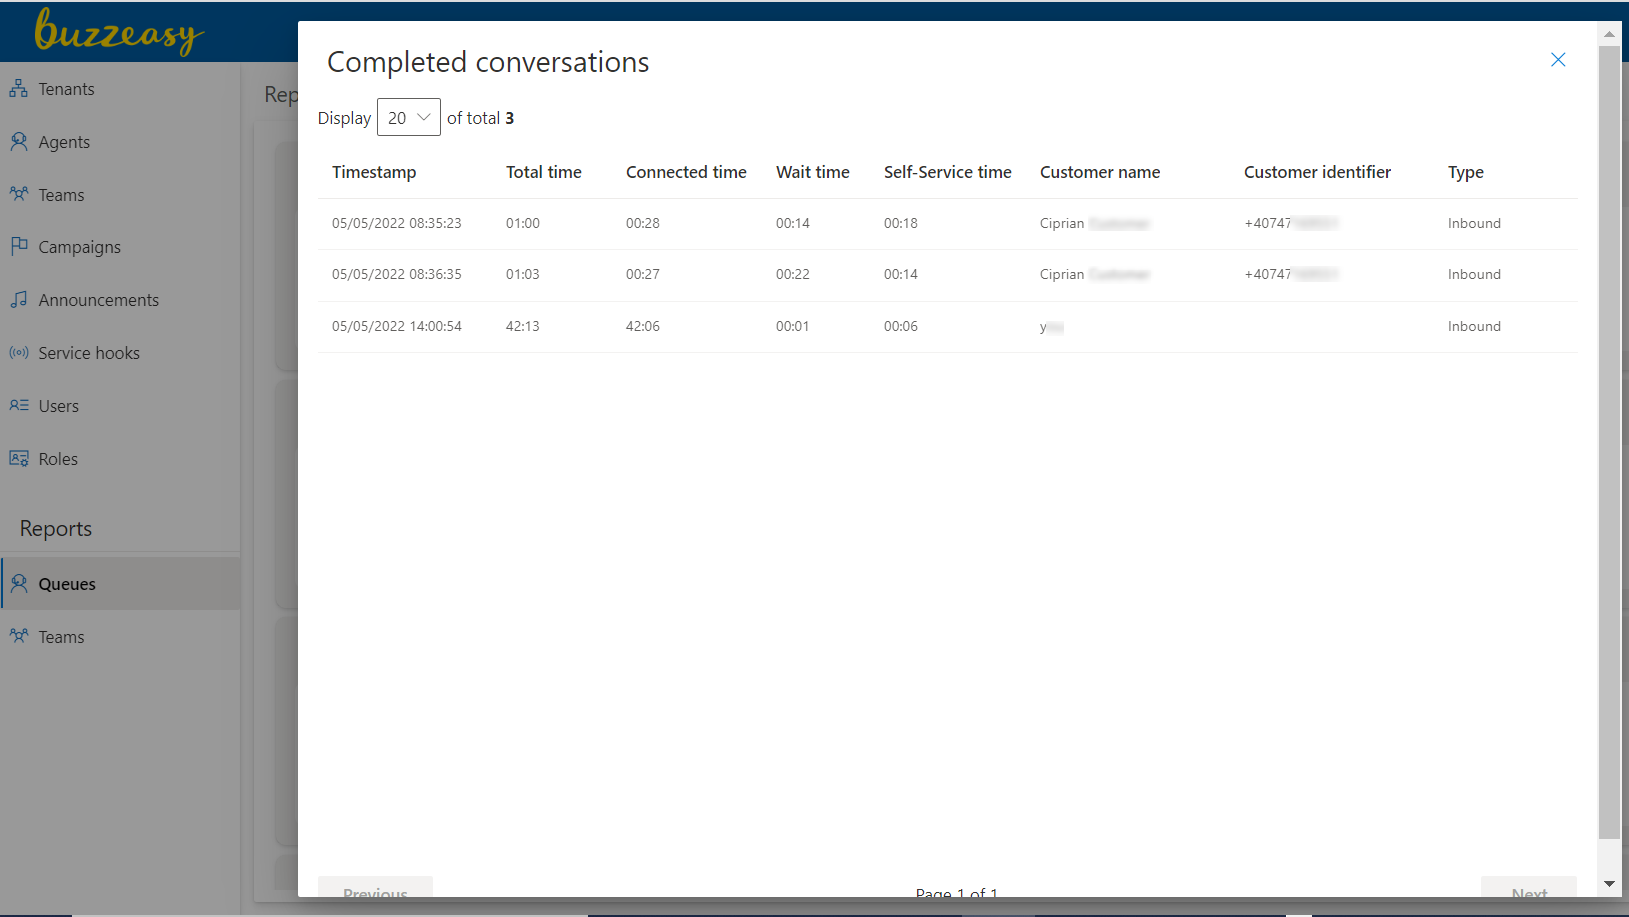
Completed KPI - Info
- Select the information icon next to the Waiting KPI, to view a list of conversations that are waiting for connection to an agent.
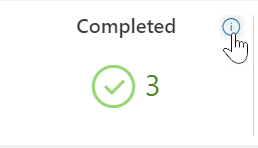
The list of completed conversations displays.
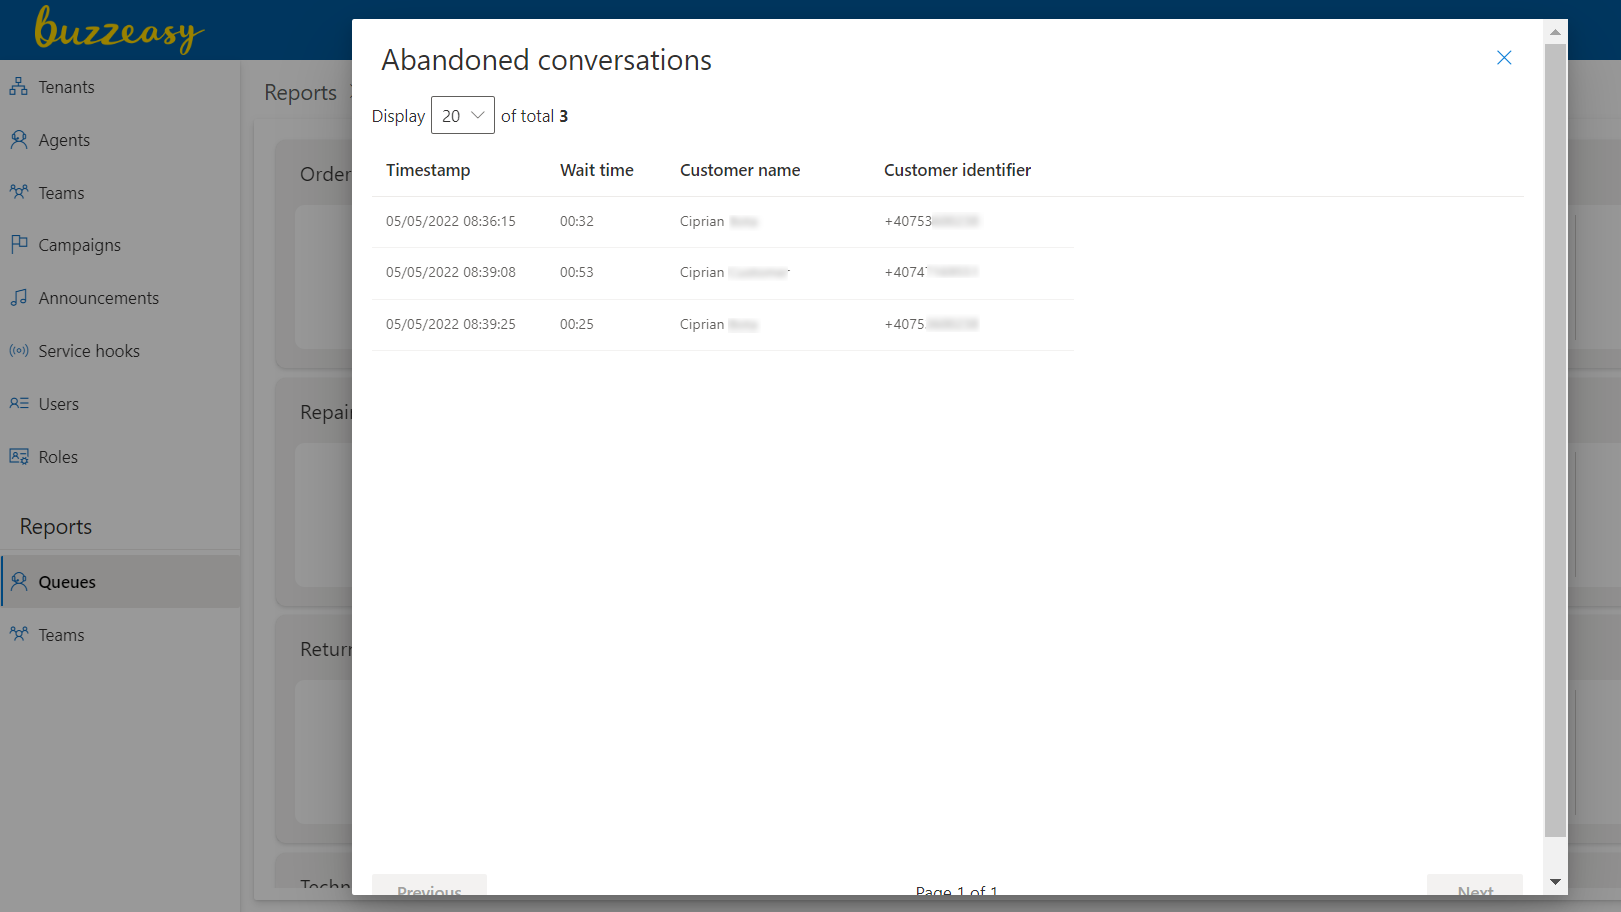
Abandoned KPI - Info
- Select the information icon next to the Waiting KPI, to view a list of conversations that are waiting for connection to an agent.
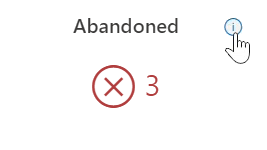
The list of abandoned conversations displays.
Queues Dashboard - KPI Descriptions
KPI Description Tables Legend
The column heading Data Threshold refers to the value at which the KPI's formatting or color changes to alert the supervisor that the data has reached a critical value and that their intervention may be required.
If the data threshold is user editable, a supervisor may enable, disable and specify the value of this threshold.
The column heading "Info icon" refers to the information icon that accompanies some of the KPIs in the dashboard.
The information icon
Entries under the Info icon heading describe if an info icon is available, and the action when the info icon is selected.
Key KPIs - Description
The key KPIs are always visible on the queues dashboard. The key KPIs display summary data. They are described below.
| KPI | Description | Data threshold | Info icon |
|---|---|---|---|
| Service Level | Daily Service Level. See Service Level Definition below. | User editable | n/a |
| Current LWT | The current longest wait time of the day. | User editable | n/a |
| Waiting | Total conversations waiting in the queue. | User editable | Yes - Lists details of waiting conversations |
| Connected | Total conversations connected with agents. | Yes - Lists details of connected conversations | |
| Completed | Daily total of completed conversations. | Yes - Lists details of completed conversations | |
| Abandoned | Daily total of abandoned calls. | Yes - Lists details of abandoned conversations |
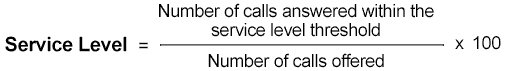
Service Level - Definition
The Service level may be calculated in many ways. It can change subject to business requirements.
This is the current formula for calculating the Service Level.
Wait Time Today KPIs - KPI Description
Two KPIs appear on a Wait Time Today tile; they are described below.
| KPI | Description | Data threshold | Info icon |
|---|---|---|---|
| (Wait Time Today) Longest | The longest wait time of the day. | n/a | |
| (Wait Time Today) Average | The average wait time of the day. | User editable | n/a |
Callback - KPI Description
The Callback Requested KPI is described below.
| KPI | Description | Data threshold | Info icon |
|---|---|---|---|
| The Callback Requested | Total of callbacks requested. | n/a |
Timed Out - KPI Description
| KPI | Description | Data threshold | Info icon |
|---|---|---|---|
| Timed Out | Total of callbacks requested that have timed out. | n/a |
Edit Data Thresholds of Queues KPIs
KPIs and their associated data visualizations may change in appearance at and above a certain critical data value. An example is where a KPI is formatted in red to signal to a supervisor that the KPI requires their attention and intervention. The value at which this change in appearance occurs is the data threshold.
Further details about what the data threshold is, may be found in the Navigate and Control Reports and Dashboards section of the guide. This part of the guide concentrates on the layout and details of setting a data threshold for each KPI.
You may Edit the Threshold of These KPIs in the Queues Report:
Service Level
Current LWT
Waiting
Wait Time Today - Average
Enable Editing of a Data Threshold - Queues Dashboard
Select Queues from the Reports heading in the Buzzeasy Portal sidebar.
Identify the queue where you want to edit a threshold.
If you want to edit the threshold of the Wait Time Today - Average KPI, you will need to display all KPIs.

Identify the pencil icon at the top left hand corner of the queue's dashboard.
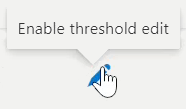
You may hover your pointer over the icon to identify the icon, the tip text Enable threshold edit appears.
Select the pencil icon.
You may now edit the thresholds of user editable KPIs. on the selected dashboard.
Enable or Disable a Data Threshold
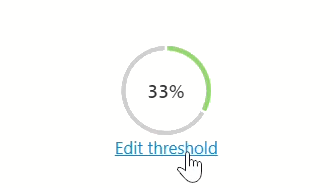
If necessary, enable the editing of a data threshold using the pencil icon. This is detailed in the steps above in Enable Editing of a Data Threshold - Queues Dashboard.
- Select the blue text "Edit threshold" on the KPI where you want to enable a data threshold, or conversely disable a data threshold.
Edit Threshold - Enable Control
A small window appears in the center of the screen and the rest of the screen appears darker.
Refer to this window as the edit threshold dialog. The dialog is similar for most data thresholds, however for some KPIs you will enter a duration, for others a value.
Use the slider control at the top right of the edit threshold dialog to enable or disable a data threshold.
Use your pointer or mouse to drag the slider control to the right or left.
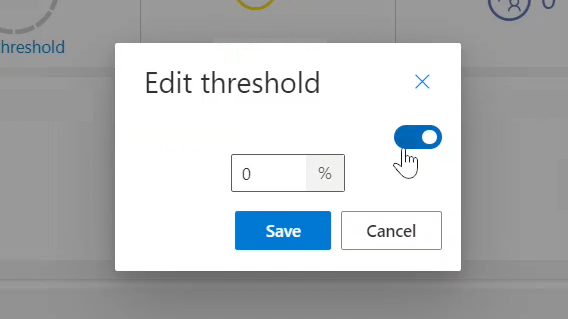
The edit threshold dialog - slider control enabled
When the slider control is enabled, it appears blue.
- Enable the slider control to enable the data threshold.
The KPI and visualization's appearance will now alter when the KPI value reaches the data threshold.
Edit Threshold - Disable Control
When the edit threshold slider control is disabled, it appears white.
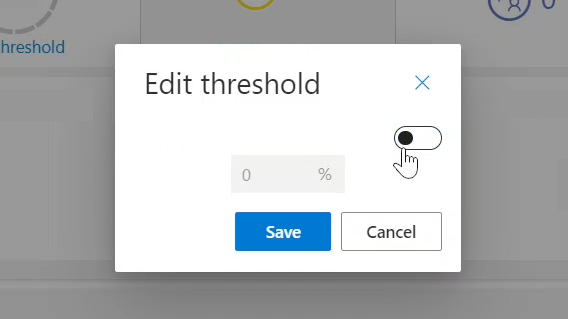
The edit threshold dialog - slider control disabled
- Disable the slider control to disable the data threshold.
The KPI and visualization will now maintain the same formatting regardless of value.
- Select Save to ensure any change you make is applied.
Service Level - Set Data Threshold
If necessary, enable the editing of a data threshold using the steps above in Enable Editing of a Data Threshold - Queues Dashboard.
Select the text Edit threshold, on the Service level KPI.
If not currently enabled, enable the control with the slider.
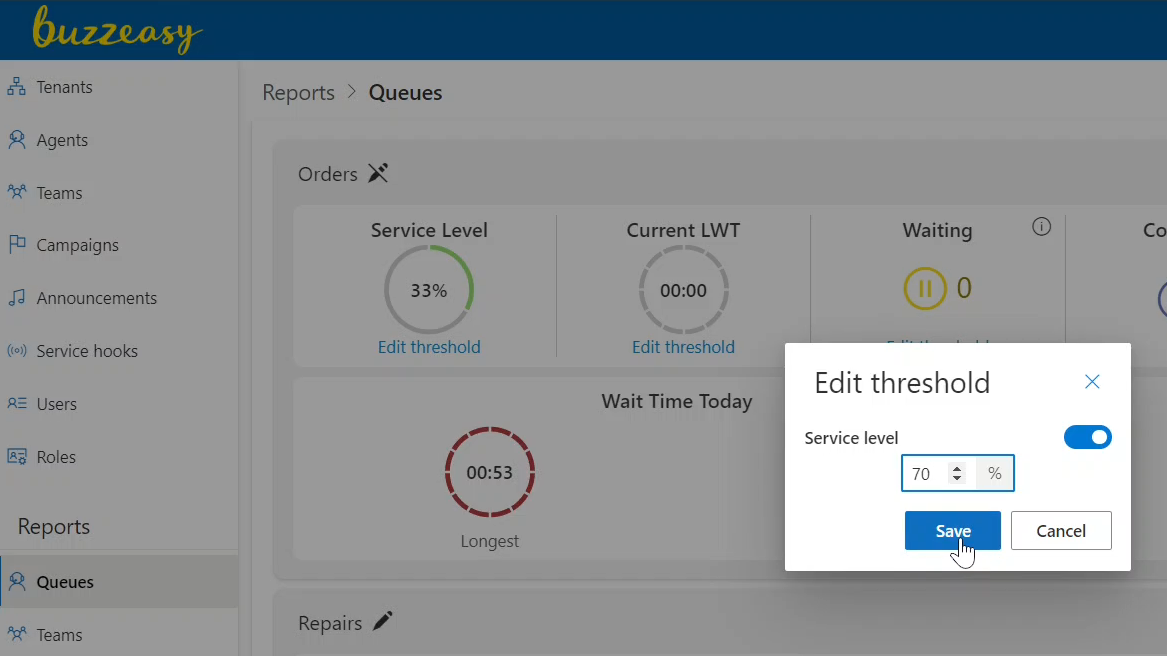
Enter a service level as a percentage.
Select save.
Current LWT - Set Data Threshold
If necessary, enable the editing of a data threshold using the steps above in Enable Editing of a Data Threshold - Queues Dashboard.
Select edit threshold on the current longest waiting time (LWT) KPI, from the Key KPIs tile in the queues dashboard.
If not currently enabled, enable the control with the slider.

Enter a duration.
Select save.
Waiting - Set Data Threshold
If necessary, enable the editing of a data threshold using the steps above in Enable Editing of a Data Threshold - Queues Dashboard.
Select edit threshold on the waiting to be on from the key KPIs tile In the queues dashboard.
If not currently enabled, enable the control with the slider.
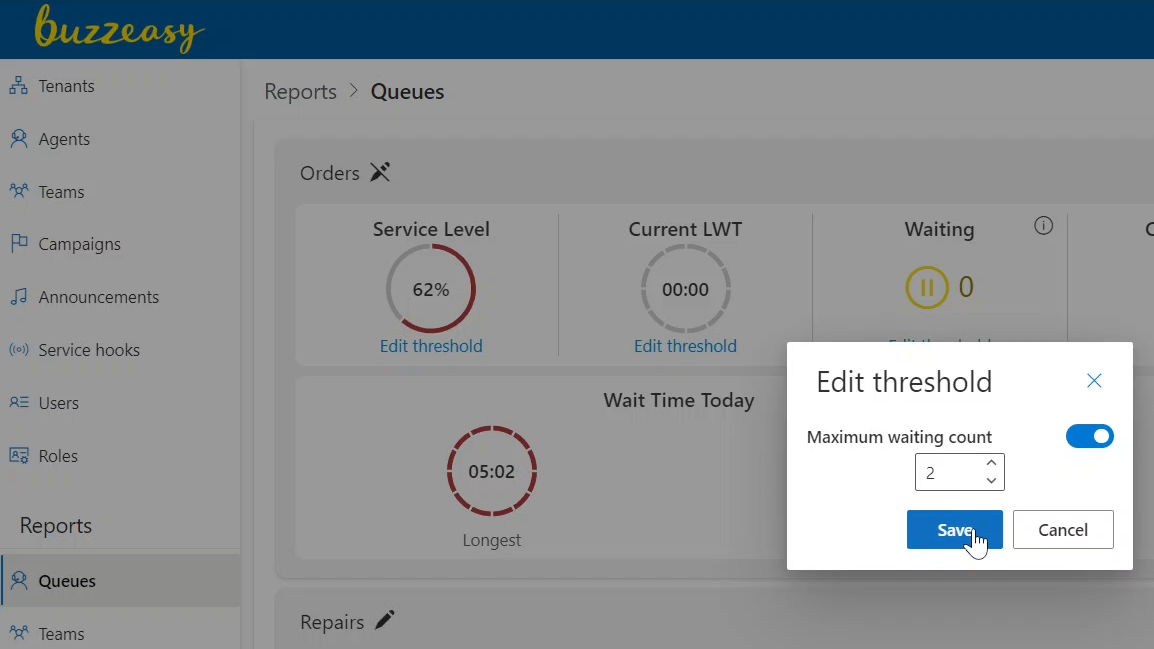
Enter a maximum waiting count total.
Select save.
Wait Time Today - Average - Set Data Threshold
If necessary, enable the editing of a data threshold using the steps above in Enable Editing of a Data Threshold - Queues Dashboard.
Select edit threshold from the average KPI in the wait time today tile.
If not currently enabled, enable the control with the slider.
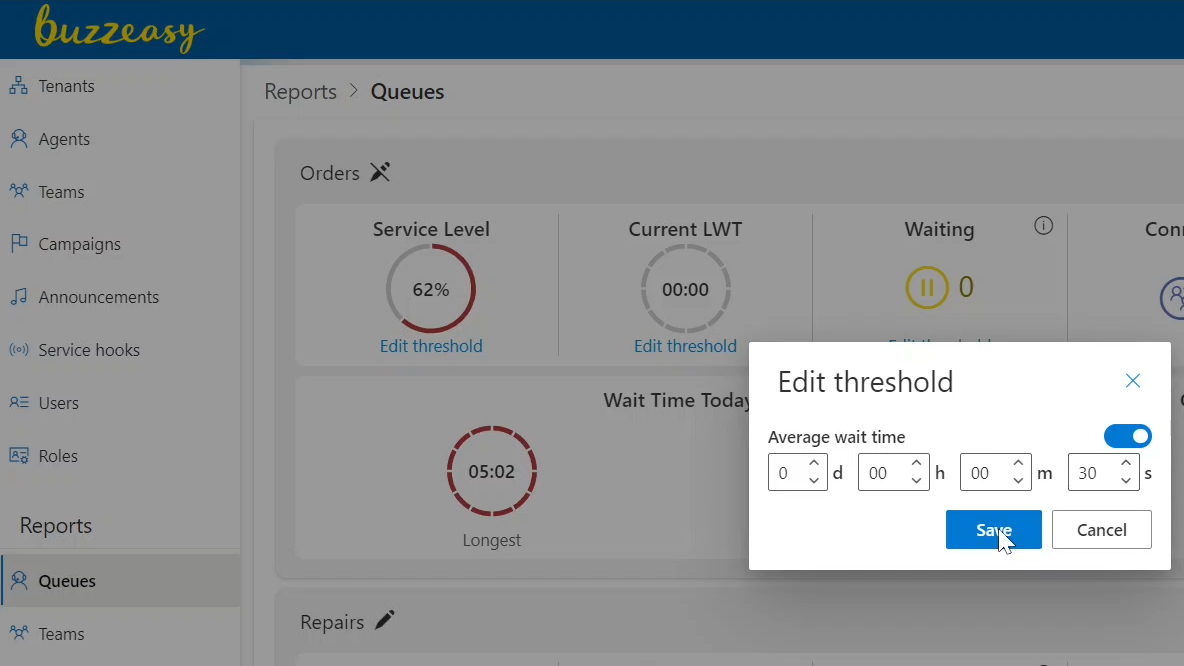
Enter a duration for the average wait time.
Select save.