The Teams Report
The Teams report consists of dashboards of KPI data.
A teams dashboard displays for each of your teams, showing data specific to that team.
Select Teams under the Reports heading in the portal sidebar to display the Teams Report.
Find out more about the general navigation and operation of all reports in the Navigate and Control Reports and Dashboards section of the guide.
This detailed description section of the guide concentrates on:
The layout of the Teams dashboard
Details of the Teams dashboard
Description of the Teams dashboard KPIs
Setting a data threshold on each KPI where this is a user editable value
Drilling in to show a chart on each KPI where this is supported
Viewing agents activity
Monitoring agents
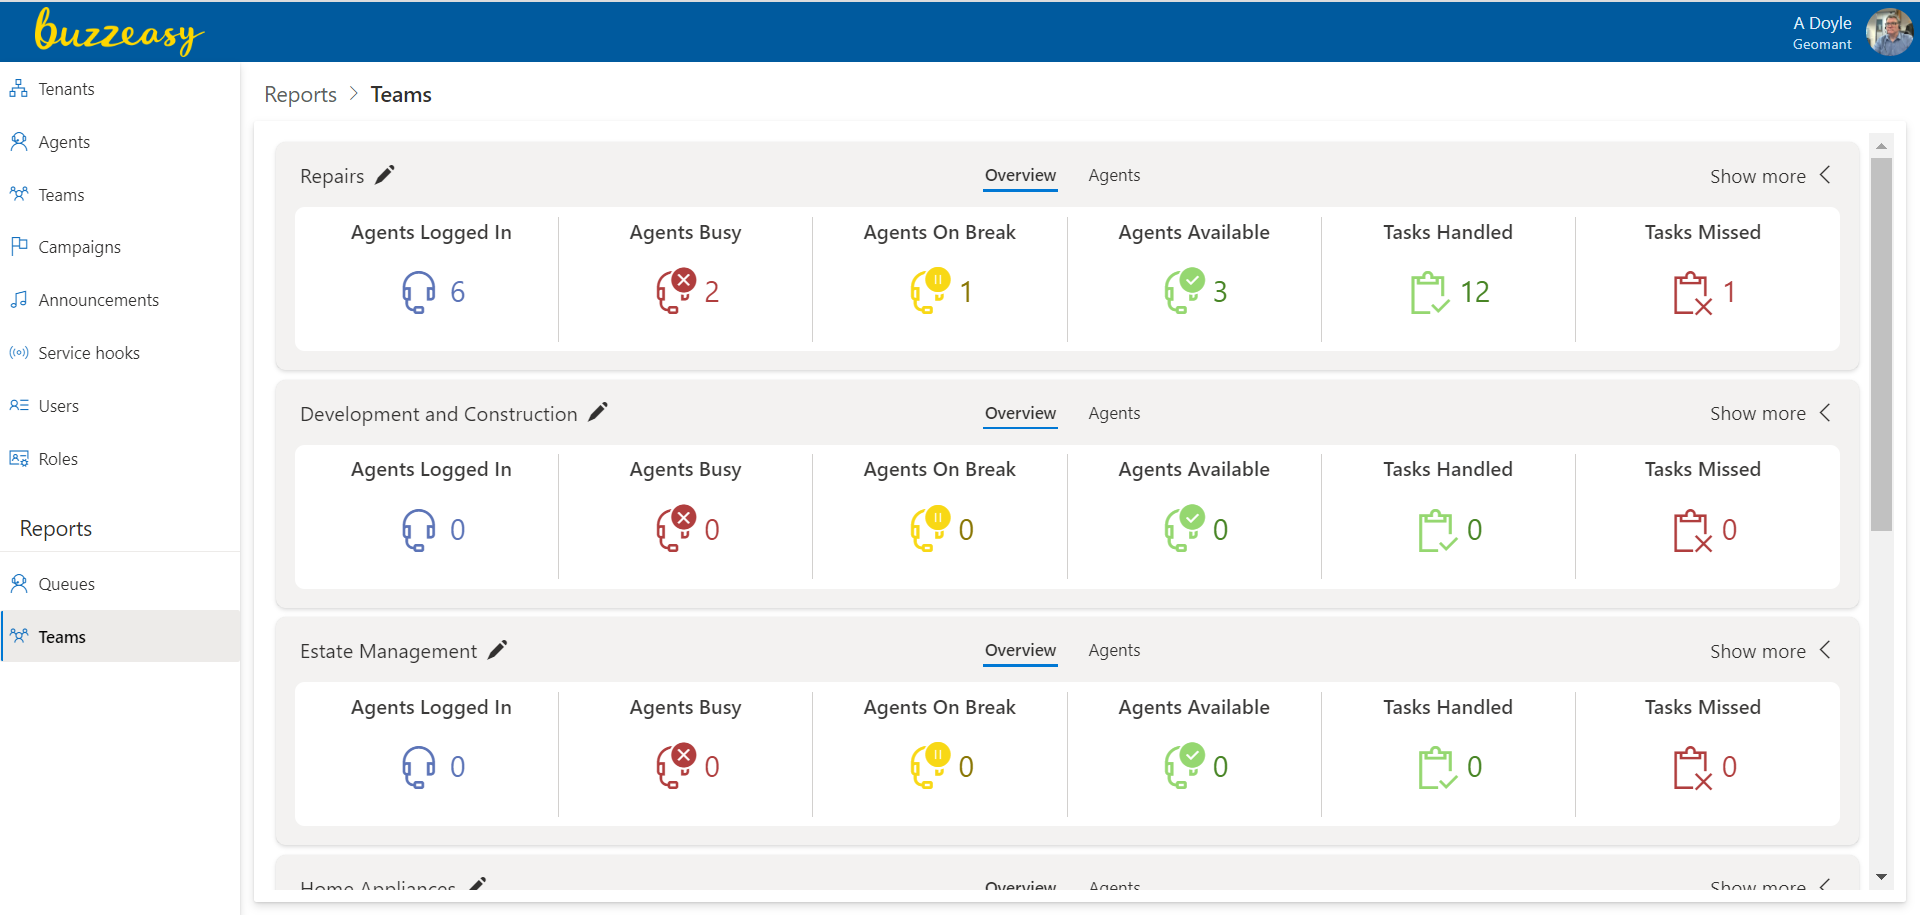
Key KPIs - Teams Dashboard
Initially each team’s dashboard displays six KPIs. Refer to this as the team’s Key KPIs.
Show More KPIs - Teams Dashboard
At the top right of each queue's dashboard is a Show more control.
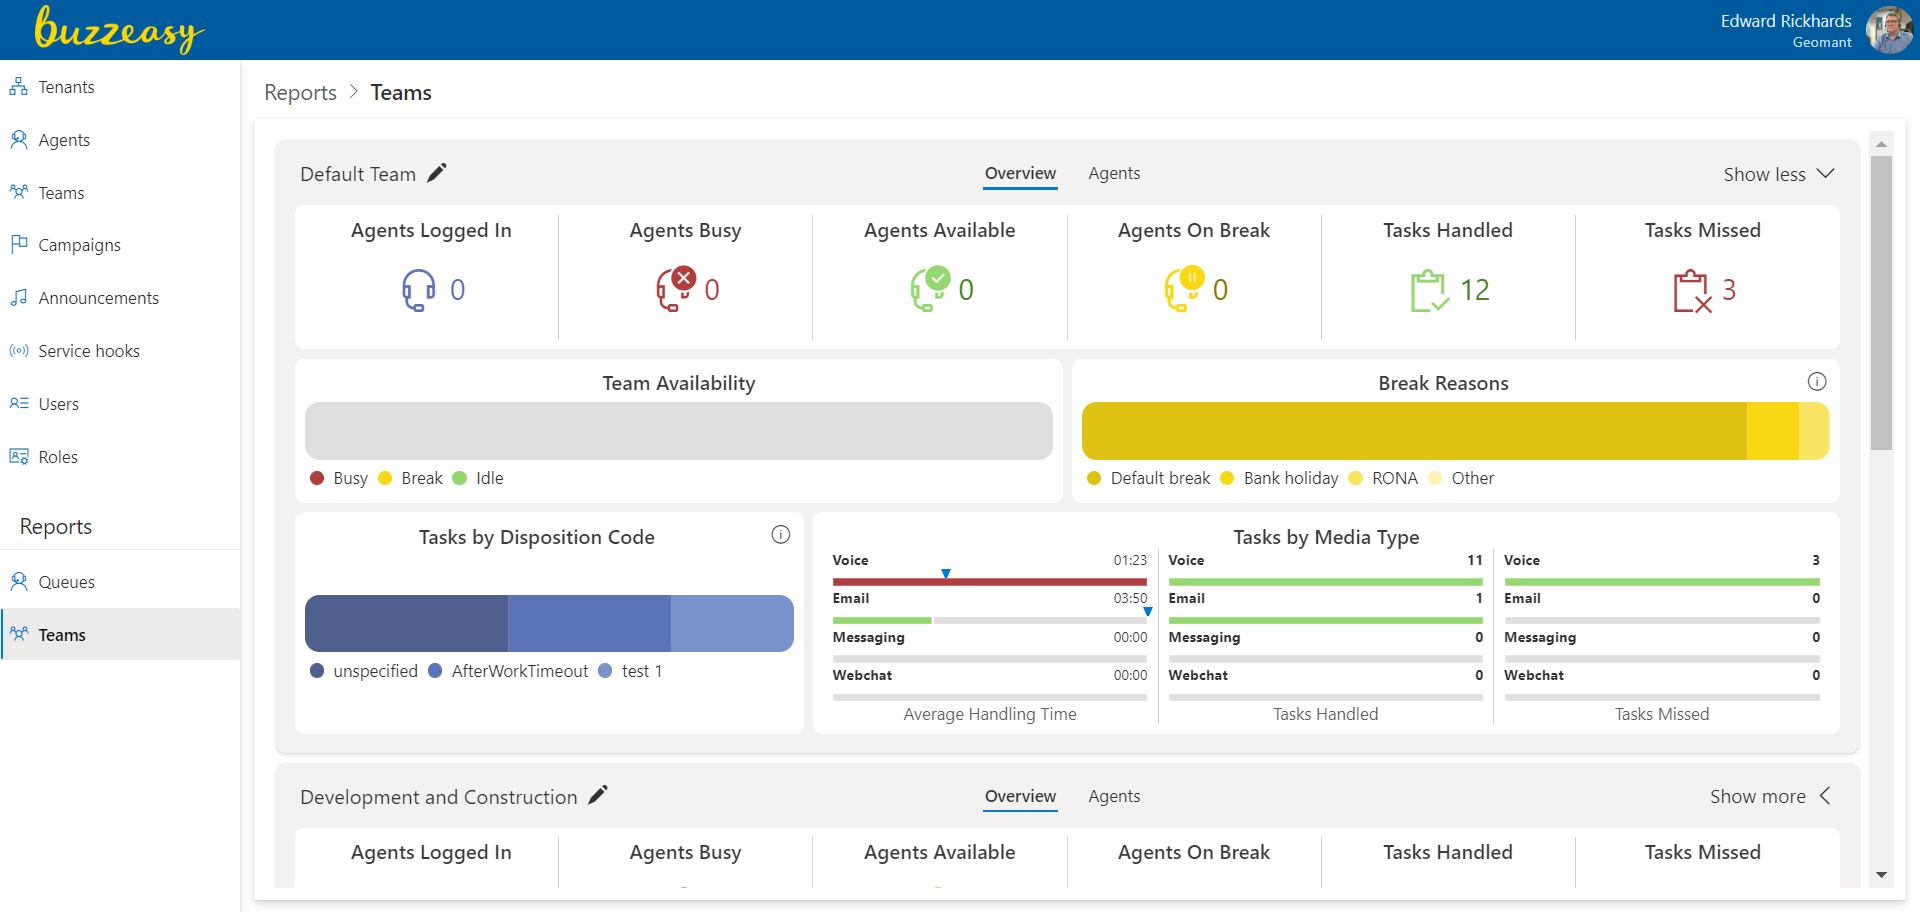
Select the Show more control to display all the KPIs on each dashboard. Four additional data visualizations of KPIs display.
Team Availability - Stacked horizontal bar chart - Three agent state durations as a percentage of total.
- Busy - Total agent busy state duration busy duration
- Break - Total of all agent break types duration
- Idle - Total of agent idle state duration
Break Reasons - Stacked horizontal bar chart - Each utilized break type duration as a percentage of total.
Tasks by Disposition Code - Stacked horizontal bar chart - Each disposition code utilized in the after-work step of closing a task, as a percentage of total.
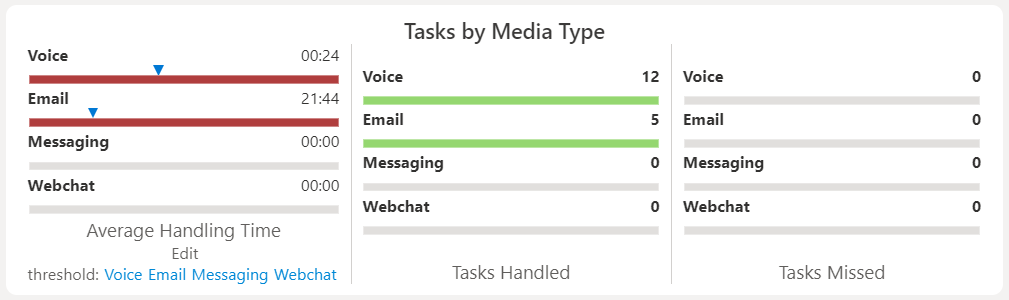
Tasks by Media Type - Three horizontal bar charts, consisting of four metrics each.
Average Handling Time
- Voice - Average call handling time
- Email - Average email handling time
- Messaging - Average messaging app conversation handling time
- Webchat - Average webchat handling time
Tasks Handled
- Voice - Total voice calls handled
- Email - Total emails handled
- Messaging - Total messaging app conversations handled
- Webchat - Total webchat conversations handled
Tasks Missed
- Voice - Total voice calls missed
- Email - Total emails missed
- Messaging - Total messaging app conversations missed
- Webchat - Total webchat conversations missed
Show Fewer KPIs - Teams Dashboard
With all the dashboard tiles visible, a Show less control appears at the top right of the dashboard.
- Select Show less, to hide the Team Availability, Break Reasons, Tasks by Disposition Code and Tasks by Media Type tiles.
View Charts - Teams Dashboard KPIs
An information icon accompanies some of the KPIs in the dashboard.

The information icon
Where a KPI or visualization has an information icon, you may select it to view further details.
In the teams dashboard the details are displayed in charts.
KPIs That Display More Information
- Break Reasons
- Tasks By Disposition Code
Break Reasons
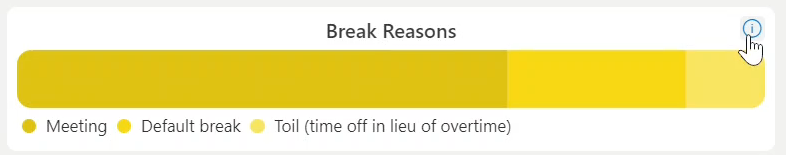
Select the info icon on the Break Reasons visualization to display a chart showing the utilization of default and configured break reasons by agents, a percentage of total break time.
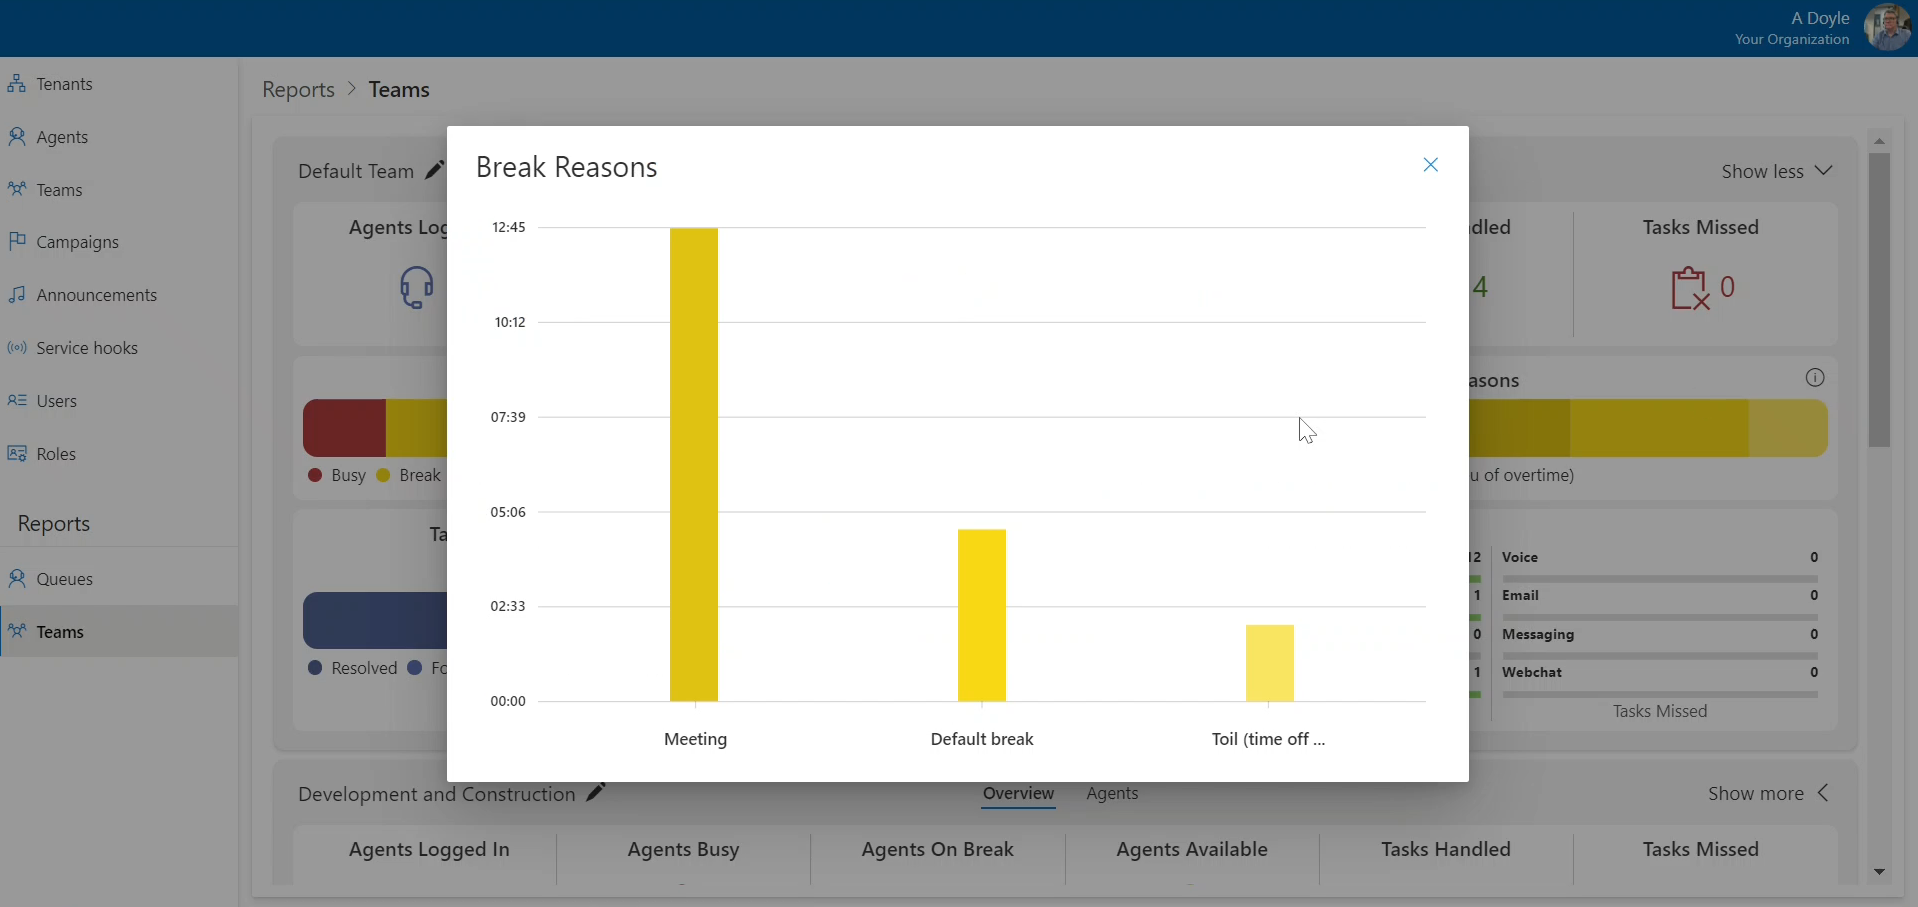
Hover your pointer or mouse over each bar to display a data legend.
Tasks by Disposition Code
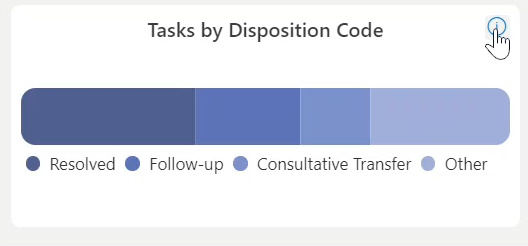
Select the info icon on the Break Reasons visualization to display a chart showing the utilization of default and configured break reasons by agents, a percentage of total break time.
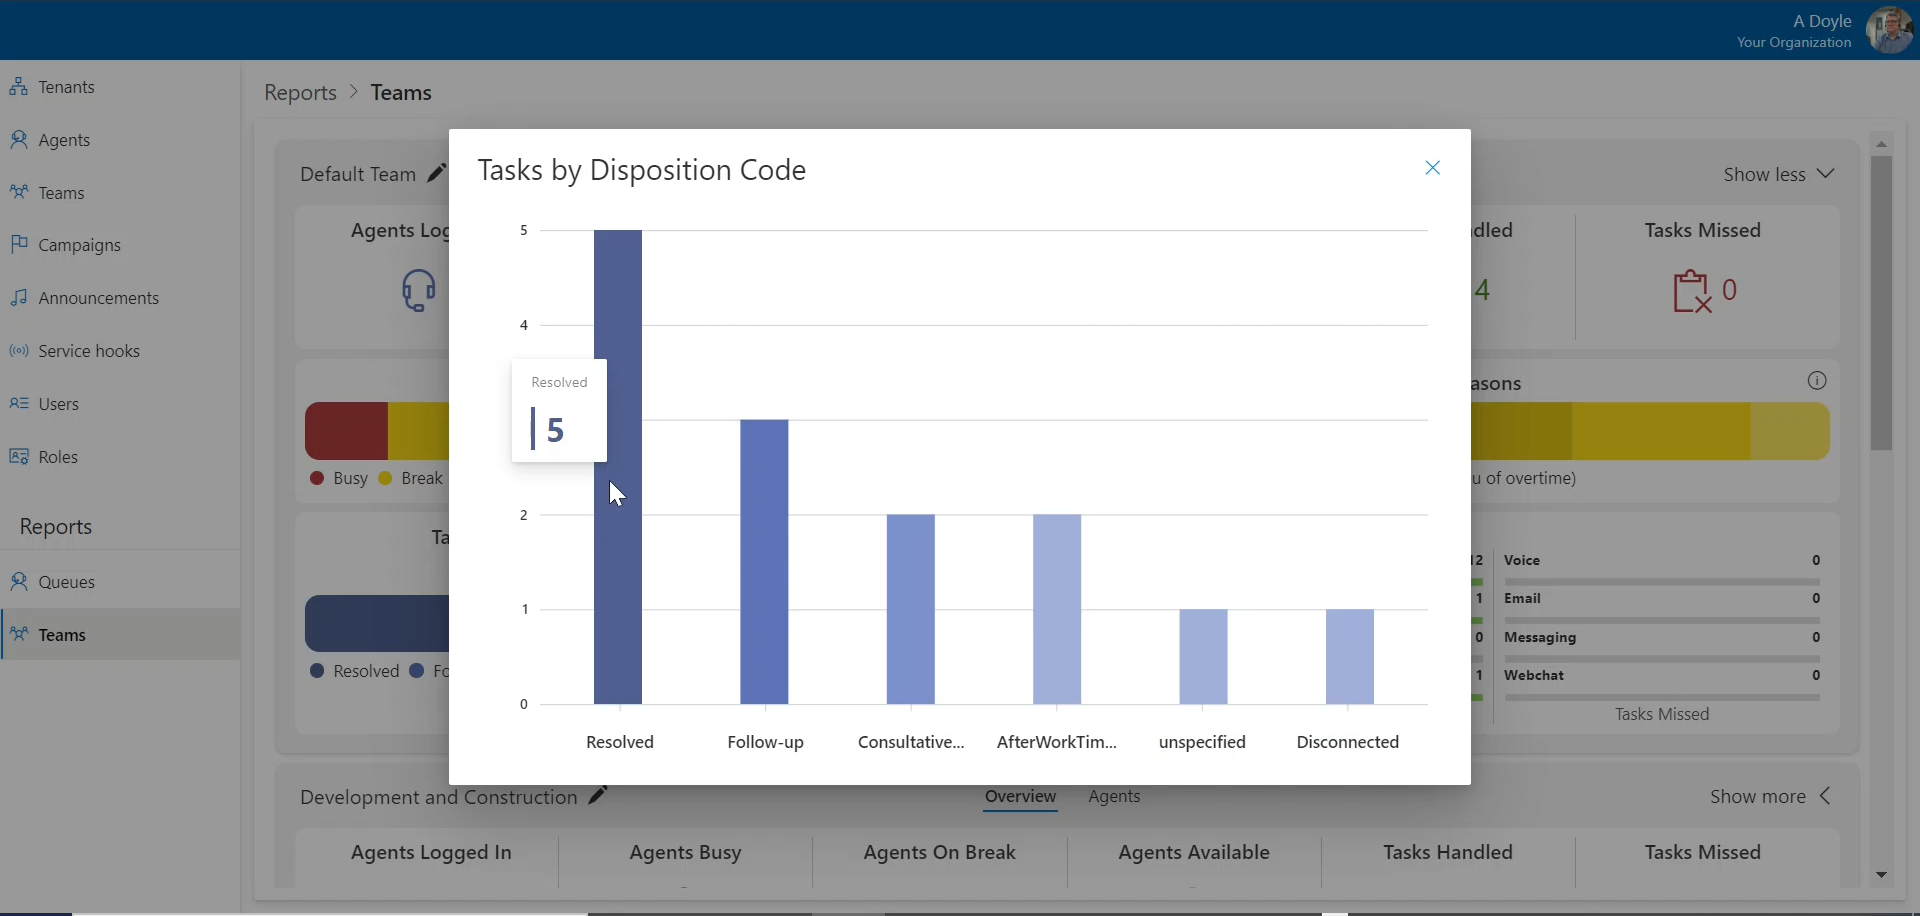
Hover your pointer or mouse over each bar to display a data legend.
KPI Descriptions - Teams Dashboard
KPI Description Tables Legend
The column heading Data Threshold refers to the value at which the KPI's formatting or color changes to alert the supervisor that the data has reached a critical value and that their intervention may be required.
If the data threshold is user editable, a supervisor may enable, disable and specify the value of this threshold.
The column heading "Info icon" refers to the information icon that accompanies some of the KPIs in the dashboard.
The information icon
Entries under the Info icon heading describe if an info icon is available, and the action when the info icon is selected.
Key KPIs - KPI Description
Six KPIs are always visible in the dashboard. Refer to these as the Key KPIs. The Key KPIs show summary information.
The key KPIs are described below.
| KPI | Description | Data threshold | Info icon |
|---|---|---|---|
| Agents Logged In | Total team member agents logged in. | n/a | |
| Agents Busy | Total agents busy with conversations. | n/a | |
| Agents On Break | Total agents on break. | n/a | |
| Agents Available | Total agents available to handle conversations. | n/a | |
| Tasks Handled | Total conversation tasks handled that day. | n/a | |
| Tasks Missed | Total abandoned conversation tasks. | n/a |
Team Availability - KPI Description
The KPIs that appear on the Team Availability data visualization, are described below.
| KPI | Description | Data threshold | Info icon |
|---|---|---|---|
| Busy | Total agents currently busy with conversation tasks. | n/a | |
| Break | Total agents currently on break. | n/a | |
| Idle | Total agents in idle state, available to handle conversation tasks. | n/a |
Break Reasons - KPI Description
The duration of time spent on break KPI appears on the Break Reasons data visualization. This KPI is presented on a stacked row chart. The stacked row chart shows the duration of each break types used, as a proportion of the total duration for all breaks.
The table below features an Administrator Configured Break Name. This this will be different at each contact center, it represents each break name you have configured.
| KPI | Description | Info icon |
|---|---|---|
| Default Break | Duration this break was used, presented visually as a proportion of all break durations - A system defined break type | yes - displays bar chart |
| RONA Break | Duration this break was used, presented visually as a proportion of all break durations - A system defined break type. | as above - one info icon on visualization |
| Supervisor Break | Duration this break was used, displays as a proportion of total duration of all breaks. System defined break type. | as above - one info icon on visualization |
| Administrator Configured Break Name | Duration a break-name configured by an administrator was used. This repeats for each configured break name. Displays as a proportion of total break durations. | as above - one info icon on visualization |
Tasks by Disposition Code - KPI Description
The KPI that appears on the Tasks by Disposition Code data visualization, is broken down by a category for each disposition code used. An administrator may define multiple disposition codes.
The table below features an Administrator Configured Disposition Code. This will be different at each contact center. It represents each disposition code you or your Buzzeasy administrator has configured.
| KPI | Description | Info icon |
|---|---|---|
| unspecified | Total number of times no disposition code was used | yes - displays bar chart |
| Administrator Configured Disposition Code | Total number of times this disposition codes was used - repeats for each configured code | as above - one info icon on the visualization |
Tasks by Media Type - KPI Description
The KPIs that appear on the Tasks by Media Type data visualization, are described below.
Tasks by Media Type - Average Handling Time
Average conversation Handling time including wrap-up.
| KPI | Description | Data threshold | Info icon |
|---|---|---|---|
| Voice | Average voice call handling time | User editable | n/a |
| Average email message handling time | User editable | n/a | |
| Messaging | Average messaging app conversation handling time | User editable | n/a |
| Webchat | Average webchat conversation handling time | User editable | n/a |
See Edit Thresholds of Teams KPIs below,for details concerning the user editable data thresholds.
Tasks by Media Type - Tasks Handled
Total conversations handled split by media type.
| KPI | Description | Info icon |
|---|---|---|
| Voice | Total voice calls handled | n/a |
| Total email messages handled | n/a | |
| Messaging | Total messaging app conversations handled | n/a |
| Webchat | Total webchat conversations handled | n/a |
Tasks by Media Type - Tasks Missed
| KPI | Description | Info icon | |
|---|---|---|---|
| Voice | Total calls redirected by RONA plus any calls abandoned whilst ringing with an agent. | n/a | |
| Total missed email conversations | n/a | ||
| Messaging | Total missed messaging app conversations | n/a | |
| Webchat | Total missed webchat conversations | n/a |
Edit Data Thresholds of Teams KPIs
You may edit the threshold of the Average Handling Time KPI on the Tasks by Media Type Type tile. These media types are supported:
- Voice
- Messaging
- Webchat
Edit a Threshold in a Teams Dashboard
- Select Teams from the Reports heading in the Buzzeasy Portal sidebar
Identify the team where you want to edit a threshold.
Select the pencil icon at the top left hand corner of the team's dashboard. You may hover your pointer over the icon to identify it, the tip text Enable threshold edit appears.
Select Show more at the top right hand corner of the team's dashboard.
Identify the Tasks by Media Type tile and the Average Handling Time within it.
You may edit thresholds for Voice, Email, Messaging, and Webchat conversations.
All of the Tasks by Media Type thresholds are set as a duration of time.
Each of the Average Handling Time data thresholds are set in the same way. The only difference appears in the details on the edit threshold dialog where the relevant media type appears.
Set Average Handling Time - Voice Data Threshold
- Select Voice
If required, enable the threshold with the slider control. The control appears blue when the threshold is enabled.
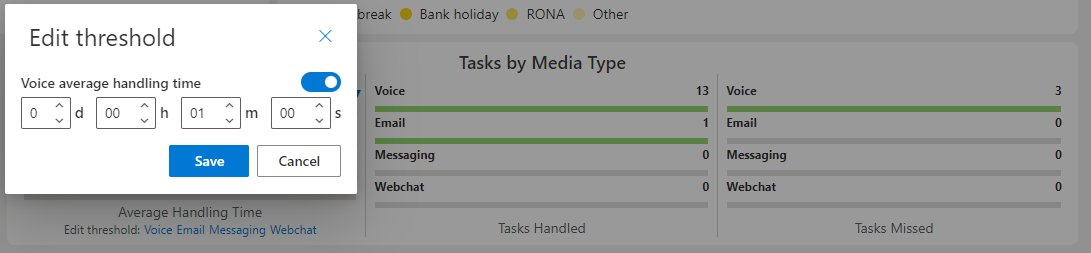
Set the required duration for the threshold.
Select Save.
Set Average Handling Time - Email Data Threshold
- Select Email
If required, enable the threshold with the slider control. The control appears blue when the threshold is enabled.
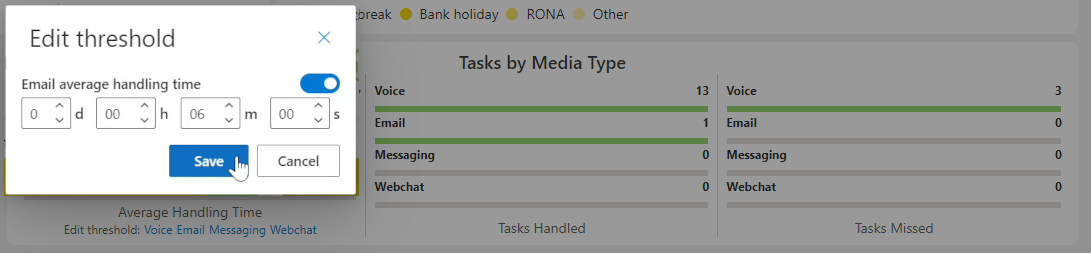
Set the required duration for the threshold.
Select Save.
Set Average Handling Time - MessagingData Threshold
- Select Messaging
If required, enable the threshold with the slider control. The control appears blue when the threshold is enabled.
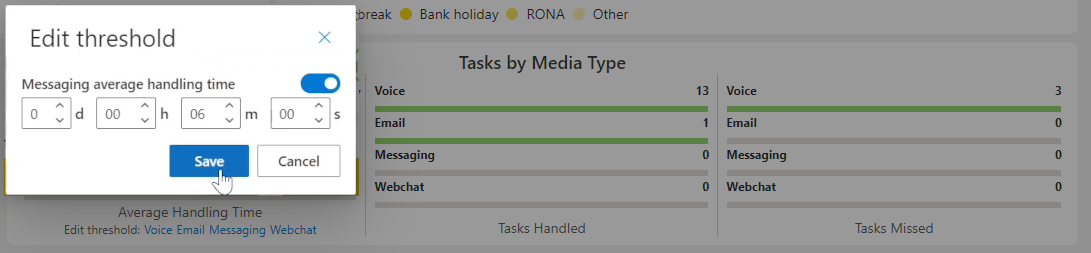
Set the required duration for the threshold.
Select Save.
Set Average Handling Time - Webchat Data Threshold
- Select Webchat
If required, enable the threshold with the slider control. The control appears blue when the threshold is enabled.

Set the required duration for the threshold.
Select Save.